
Figure 6.
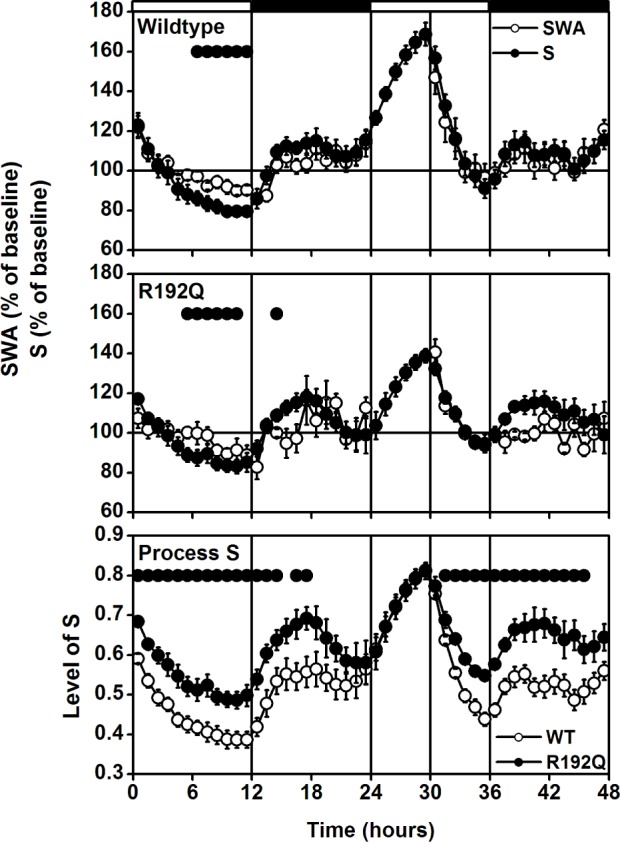
A 48-h record of EEG slow-wave activity (SWA, EEG power density between 0.75-4.0 Hz) in non-rapid eye movement (NREM) sleep and simulation of Process S for wild-type (top panel) and Cacna1a R192Q (R192Q) mice (middle panel). Curves connect 1-h mean values (± SEM) for the 24-h baseline day, 6-h sleep deprivation, and 18-h recovery. SWA in NREM sleep and the level of process S are expressed as a percentage of the 24-h baseline value (= 100%). The vertical lines and black and white bars indicate the light dark cycle and the SD. The SWA values are the same as in Figure 1. The bottom panel represents the hypothetical level of sleep pressure, based on the levels of Process S in the top and middle panel. Dots in the top and middle panel indicate where SWA and simulation differed significantly from each other (P < 0.05, 2-tailed paired t-test after significant ANOVA factor treatment). Dots in the bottom panel indicate where the simulated sleep pressure differed significantly between wild-type and Cacna1a R192Q (P < 0.05, 2-tailed t-test after significant ANOVA factor genotype).