

Abstract
Study Objectives:
Prior studies using positron emission tomography (PET) or single-photon emission computed tomography techniques have reported inconsistent findings regarding differences between patients with restless legs syndrome (RLS) and control patients in the striatal dopamine-2 receptor (D2R) binding potentials (BP). D2R-BP does reflect receptor-ligand interactions such as receptor affinity (Kd) and density (βmax) or neurotransmitter synaptic concentrations. Thus, differences in D2R-BP reflect changes in these primary factors. PET techniques are currently available to estimate D2R βmax and Kd.
Design:
Separate morning and evening PET scans were performed. The D2R-BP were measured in basal ganglia using [11C]raclopride.
Setting:
Academic medical center.
Patients or Participants:
Thirty-one patients with primary RLS and 36 age- and sex-matched control patients completed the study.
Measures and Results:
Patients with RLS had lower D2R-BP in putamen and caudate but not the ventral striatum. A subgroups analysis of those RLS patients who had not previously taken dopaminergic medications continued to show a significantly lower D2R-BP in the posterior putamen. D2R-BP did not differ between night and day for either group. D2R βmax and Kd did not differ significantly between patients with RLS and control patients but did show a strong and significant increase at night in the ventral striatum. Primary and secondary clinical measures of disease status failed to show any relation to D2R in any brain region.
Conclusions:
Given the lack of any difference in either βmax or Kd and the prior studies supporting an increase in presynaptic dopaminergic activity, the current changes found in D2R-BP likely reflect an increase in synaptic dopamine.
Citation:
Earley CJ; Kuwabara H; Wong DF; Gamaldo C; Salas RE; Brašić JR; Ravert HT; Dannals RF; Allen RP. Increased synaptic dopamine in the putamen in restless legs syndrome. SLEEP 2013;36(1):51–57.
Keywords: Diurnal, dopamine receptor, positron emission tomography, restless legs syndrome, striatum
INTRODUCTION
Restless legs syndrome (RLS) is a sensory-motor disorder that is reported to affect from 5% to 10% of the population.1 The dramatic benefits seen with the use of dopaminergic (DAergic) medications in the management of RLS symptoms indicates the importance of DAergic function in the syndrome.2 Research studies, although mixed in their findings, also support a role for altered DAergic function. Positron emission tomography (PET) and single-photon emission computed tomography (SPECT) studies have generally shown lower dopamine-2 receptor (D2R) binding potential (BP), but some studies have shown no changes and in one study, an increase in D2R.3 A recent study, however, in postmortem brain sections found decreased D2R in the putamen from patients with RLS. The putamen D2R concentrations also showed a strong negative correlation (r = −0.8) to premortem RLS severity on the international RLS severity scale with the decreases below normal levels occurring only for the severe cases.4
Although PET/SPECT studies have been used to examine dopamine receptor and transporter BP, little in the way of more dynamic assessment of D2R function has been reported for RLS. The D2R-BP, as a defined outcome variable in PET studies, reflects three interacting factors: the density of the receptors on the membrane (βmax), the receptor-ligand dissociation constant or receptor affinity (Kd), and the amount of extracellular dopamine.5–7 This study, therefore, used special PET techniques to determine whether RLS patients differ from control patients for D2R-BP, -βmax, or -Kd. Furthermore, because a primary feature of RLS is its circadian dynamics, with RLS symptoms worse at night and quiescent in the morning,8 the study was designed to assess for diurnal differences in D2R-BP, -βmax, or -Kd.
METHODS
All patients gave consent according to the Johns Hopkins University Institutional Review Board, which is in keeping with guidelines of the Declaration of Helsinki.9 All patients were screened using the RLS diagnostic questionnaire, leg meters, blood work, apnea monitoring where indicated, and finally a telephone diagnostic interview (TDI) using the validated Hopkins TDI10 performed by an RLS specialist (RPA). Patients with RLS had to have all four defining features of RLS11 and not have other symptoms or conditions that might mimic RLS in order to have a definite RLS diagnosis. Control patients had to have no positive responses to any of the four defining RLS features in order to have a definite not-RLS diagnosis. Patients were excluded if apnea-hypopnea index > 25/h (on polysomnogram), if medical conditions (e.g., chronic inflammation, or renal or hepatic failure) or medications (e.g., antidepressant, neuroleptic agent) were considered likely to compromise our ability to make the diagnosis of RLS or to perform or interpret the PET results. Control patients were excluded if a family history of RLS was reported or if periodic limb movements (PLMs) by leg meter were > 10/h on any single night over a 4- to 5-night evaluation at home. The PLMs exclusion criteria were based on leg meter data for 4 to 5 nights at home, not on the PLMS from the polysomnogram study. Patients with RLS were excluded if symptoms occurred less than twice per week, if symptoms were two to six times per week but PLMs were < 10/h average over 4 to 5 nights based on home assessment using leg meters, or if any secondary cause other then iron deficiency was suspected. PLMs were determined for screening purposes using leg meters (PAM-RL), which are small watch-size devices worn on each ankle that record and store specific leg movements (PLMs/hr).12 Patients were withdrawn from all central nervous system-active medications including RLS medications at least 11 days prior to the study or at least six half-lives, whichever was longer. Control patients were age- and sex-matched to the patients with RLS.
All patients were admitted to the Johns Hopkins Bayview General Clinical Research Center (GCRC) for 4 days. At that time, the medical and RLS history were reviewed and using the Hopkins TDI10 a face-to-face assessment was performed to ensure that the patient was either “definite” RLS or definite not-RLS. While in the GCRC patients had a suggested immobilization test (SIT) followed by a full nighttime polysomnogram on two sequential nights. These were performed and scored as previously described.13 Patients with RLS also filled out RLS-related rating scales and sleep diaries as previously described.13
PET Procedures
PET imaging was performed on a GE Advance PET scanner (GE Medical Systems, Milwaukee, WI, USA) with a 14.875-cm axial field of view. All patients had venous and arterial lines placed at least 2 h prior to the scan. The patient was positioned in the scanner with the head slightly immobilized with a custom-made thermoplastic mask to reduce head movement during the scan. All patients had a wedge-shaped pillow flexing their legs at the knees; we found that this positioning reduced the frequency and intensity of leg symptoms during the scan in patients with RLS. After a transmission scan with a [68Ge] source for attenuation correction, a 90-min emission scan in a three-dimensional mode started with a slow bolus injection of [11C]raclopride (19.3 ± 1.2 mCi; mean ± standard deviation [SD]). Arterial blood was sampled in rapid intervals (< 5 sec) initially and with prolonging intervals toward the end of the emission scan. Selected samples were analyzed by high-pressure liquid chromatography for radioactive metabolites in plasma using previously reported methods14. Each emission scan was reconstructed to 35 transaxial images of 128 by 128 voxels by a back-projection algorithm using the manufacturer-provided software correcting for attenuation, scatter, and dead time. Resulting resolution was approximately 6 mm at full-width half-maximum.15
[11C]Raclopride(RAC) was synthesized with minor changes in purification and formulation according to the published procedure.16 The high-specific activity RAC (HSA-RAC) scan involving a single bolus injection of 11C-raclopride was used to determine the D2R BP. The low-specific activity RAC (LSA-RAC) scan involves the concurrent injection of 11C-raclopride followed by an infusion of nonradioactive raclopride. In LSA-RAC scans, nonradioactive raclopride was added to the [11C]raclopride solution targeting to achieve an SA of 15 mCi/μmol. Final specific activity (SA) adjusted to the injection time was used for calculation of βmax and Kd. Observed SA averaged at 10,357.0 ± 6,601.2 mCi/μmol (mean ± SD; range: 1,622.8 - 35,961) and 17.3 ± 4.0 mCi/μmol (range: 9.9 - 29.7) for HSA- and LSA-RAC scans, respectively. The results from the HSA- and LSA-RAC scans were used to determine the D2R-Kd and -βmax. The scan sequence schedules were: HSA-RAC started at 08:30 (day study) or 07:30 (night study) and the LSA-RAC started at 10:30AM or 09:30PM.
Magnetic Resonance Imaging Procedures and Volumes of Interest
On a separate occasion, a spoiled gradient (SPGR) sequence magnetic resonance imaging (MRI) was obtained on each patient using the following parameters: repetition time, 35 ms; echo time, 6 ms; flip angle, 458; slice thickness, 1.5 mm with no gap; field of view, 24 × 18 cm2; image acquisition matrix, 256 × 192, reformatted to 256 × 256. The volumes of interest (VOI) for putamen, caudate nucleus, and cerebellum were defined on MRI using the three-dimensional interactive-segmentation mode of a locally developed VOI defining tool.17 Then, striatal VOIs were classified into the ventral striatum, and anterior/posterior putamen and caudate nucleus (five subdivisions per side18–19) following local modifications17 to incorporate anatomical information given by postmortem human materials.20 Of the five subdivisions, anterior putamen and anterior and posterior caudate nucleus were classified as associative striatum, while posterior putamen represented motor striatum, and ventral striatum consisted of limbic striatum.18 VOIs were transferred from MRI to PET space according to MRI-to-PET coregistration parameters obtained with a statistical parametric mapping-5 module for this purpose,21 and applied to PET frames to obtain regional time-activity curves (TACs).
Derivations of PET Outcome Variables
Regional values of D2R-BP of the HSA-RAC scans were obtained by the multilinear reference tissue method with two parameters (MRTM2),22 using cerebellum as the reference tissue (i.e., with negligible specific binging). Regional values of D2R-βmax and -Kd were obtained by the bolus-plus-infusion transformation (BPIT) of bolus-injection scans23 using the prediction formula of bolus-plus-infusion scans.24 Briefly, it was mathematically demonstrated that, when transformed TACs (the time course of tissue or plasma radioactivity) of striatum and reference regions approached respective plateaus (AC and RC, respectively), bound (BC / SA = (AC - RC) / SA where SA is the specific activity) and free (FC / SA = RC / SA) nonradioactive RAC are related to βmax and Kd by the following Eadie-Hofstee equation: BC / SA = -Kd (BC / FC) + βmax. It was confirmed in practice that plateaus were achieved from 40 min to 90 min for LSA-RAC and HSA-RAC scans.
Explanation of the Mathematical Variables Noted Previously
The symbol A stands for radioactivity in a target region (i.e., receptor rich regions), and R stands for radioactivity in a reference region (negligible receptor density). B and F are defined for target regions and stand for bound and free ligands, respectively. The subscript stands for the values of those variables at assumed steady state (t > t* min; Thus, Ac is mean of A(t) after BPIT from t* to the end of scan). Ac and Rc stand for plateau values of receptor-rich and -free regions, respectively, after BPIT. Fc and Bc stand for plateau values of free and bound radioligands, respectively, after BPIT in a receptor-rich region.
Hypotheses and Statistical Analysis
Rationale and Hypotheses
Although prior PET/SPECT studies have shown mixed findings, most of the findings showed either no change or a decrease in D2R-BP.3 Furthermore, in RLS brain autopsy tissue, D2R density in the putamen was decreased.4 Based on these arguments, we selected a directional hypothesis of decreased D2R-BP. If the decrease in D2R-BP is attributable to changes in βmax or Kd, then we would expect a decreased D2R-βmax or increased D2R-Kd. Our primary region of interest for which we expect changes is the putamen because this is the region for which changes in D2R were found in autopsy tissue.4 Thus, the putamen (anterior or posterior) was selected to be our primary region of interest, whereas the caudate nucleus (anterior and posterior) and the ventral striatum (i.e., nucleus accumbens) are secondary regions of interest.
The other primary hypothesis is that the D2R-BP, D2R-βmax, and D2R-Kd will differ between morning and evening studies. We have no animal data or human RLS autopsy data on circadian changes for any of these variables; therefore, no directional hypotheses or primary regions of interest were chosen a priori for the analysis. The D2R-BP, -Bmax, and -Kd PET data were submitted to a multivariant analysis of variance to assess the effects of disease state (RLS/control), time of day (day/night), and interactions between the two factors. Chi-square analysis was used to assess sex balance.
RLS Clinical Measures and Analysis
Sleep efficiency and PLMS from the second night polysomnogram, the International Restless Legs Syndrome severity scale score, and the number of hours of RLS symptoms reported by the patient on a RLS-sleep diary during their stay in the GCRC were used as primary clinical measures of disease state. Secondary measures include age of symptom onset, duration of RLS symptoms, Johns Hopkins RLS severity scale, PLM on an evening SIT, and serum measures of iron status (early morning fasting ferritin, iron, total iron binding capacity, and percent iron saturation). Differences between control patients and patients with RLS for the primary and secondary clinical measures were analyzed using a t-test. When a difference between patients with RLS and control patients was found for D2R-BP, D2R-βmax, or D2R-Kd in any of the brain regions, a Pearson correlation coefficient was performed to assess the relation between those PET findings and the clinical measures.
RESULTS
Thirty-six control patients, balanced for sex (male/female) and age (day study: (11 of 11) 60 ± 8.1 yr; night study: (five of nine) 58 ± 6.1 yr), and 31 patients with RLS (day study: (six of 14) 61 ± 8.6 yr; night study: (five of six) 57 ± 10.1 yr) completed the study. No significant difference in age was found in comparing disease groups (RLS versus control: F = 0.1, P = 0.76), study time (day versus night: F = 1.11, P = 0.3), and interaction effects (disease × study time: F = 0.22, P = 0.64). There were no significant sex differences found between RLS and control cohorts when day-study patients (χ2 = 1.74, P = 0.19), night-study patients (χ2 = 0.24, P = 0.62), and all patients (χ2 = 0.56, P = 0.46) were assessed. The data for the D2R-BP are presented in Table 1. Our primary hypothesis that D2R-BP will be decreased in the putamen of patients with RLS was affirmed: the patients with RLS have lower D2R-BP in the putamen, which was significant for the posterior putamen (P = 0.001) and marginally nonsignificant for the anterior putamen (P = 0.06). The RLS group also showed decreased D2R-BP in the anterior (P = 0.035) and posterior caudate (P = 0.043), but not in the ventral striatum (P = 0.33).
Table 1.
The mean ± standard deviation of D2R binding potentials in the subregions of the striatum from patients with RLS and control patients during day and night assessmentsa

To assess the effects that prior dopaminergic treatment may have had on the D2R-BP data, we examined a subset of patients with RLS who had never received DAergic agents. This dopamine-drug-naïve RLS group included 10 day- and four night-study cases. The mean ages (± SD) for the RLS (58.6 ± 10.6 yr) and control (N = 36; 58.8 ± 7.3 yr) groups were not significantly different (F = 0.014; P = 0.91). The sex (male/female) ratio between RLS (five of nine) and control groups (16 of 20) was also well balanced (χ2 = 0.32, P = 0.57). The data for the D2R-BP in dopamine-drug-naïve RLS and control groups are presented in Table 2. The D2R-BP in posterior putamen (P = 0.02) was still found to be decreased in patients with RLS whereas BP in all other region failed to reach significance (P > 0.05).
Table 2.
The mean ± standard deviation of D2R binding potentials in the subregions of the striatum from DAergic-drug-naïve RLS and control patients during day and night assessmentsa

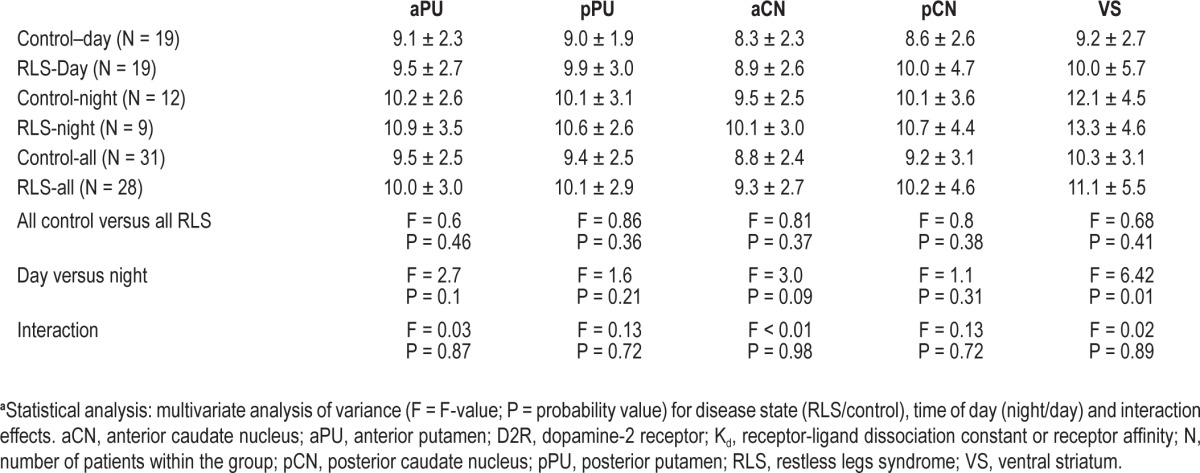
The D2R-βmax and the apparent D2R-Kd data are presented in Tables 3 and 4, respectively. There were no significant differences between RLS and control groups in the putamen, caudate, or ventral striatum for either the D2R-βmax or D2R-Kd. All of the regions, however, showed major or minor increases in D2R-βmax at night compared with day, with the ventral striatum showing the most significant (P = 0.0003) and largest effect size (> 1) and it was the only region showing a significant increase in D2R-Kd (P = 0.014). There were no interaction effects found for any of the regions indicating that day-night effects seen with D2R-βmax and D2R-Kd were independent of the disease state.
Table 3.
The mean ± standard deviation of D2R-βmax in the subregions of the striatum from RLS and control patients during day and night assessmentsa
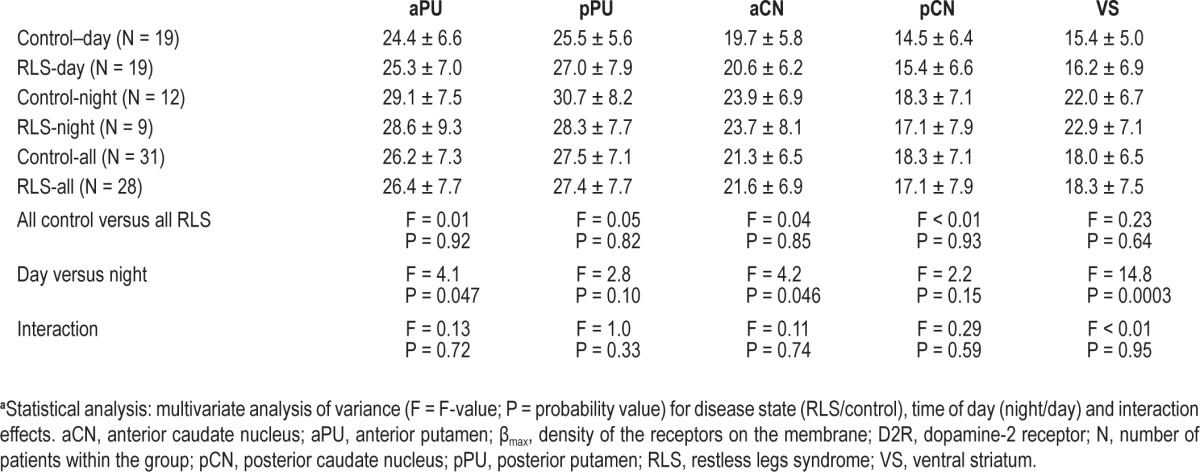
Table 4.
The mean ± standard deviation of apparent D2R-Kd in the subregions of the striatum from RLS and control patients during day and night assessmentsa
Compared with the control patients, the RLS group had a significantly lower total sleep time (RLS versus control, mean ± SD: 280 ± 77 versus 335 ± 55, P = 0.002), lower sleep efficiency (RLS versus control, mean ± SD: 83 ± 14 versus 90 ± 7.2, P = 0.01), and greater PLMS/h index (RLS versus control, mean ± SD: 67 ± 56 versus 12 ± 20, P = 0.001). Primary clinical data including PLMS and sleep efficiency on the second night polysomnogram, the number of hours of RLS symptoms reported on a RLS sleep diary during their stay in the GCRC, and their score on the International Restless Legs Syndrome severity scale were analyzed for any potential relationship to the D2R-BP in the anterior and posterior putamen. No significant correlations were found. Analyses using the secondary variables also found no significant association of D2R-BP, D2R-βmax, or D2R-Kd in any brain region to any of the clinical variables.
DISCUSSION
There have been five PET/SPECT imaging studies reporting lower,25–29 two reporting no difference,30–31 and one reporting greater striatal D2R-BP32 for patients with RLS compared with control patients. There are multiple reasons, which have been discussed elsewhere,3 for the discrepancy among these studies. Prior DAergic medications usage, age, and RLS severity differences between study groups are, however, considered the most likely factors to have biased the outcomes of these aforementioned studies. Using both PET and SPECT techniques, striatal D2R receptors have been shown to be lower for older adults.30,33 Age, therefore, represents a clear and important confounder in any of the previous PET/SPECT studies. If we exclude studies with potential age-related bias, there remains the current study and two others reporting lower D2R-BP,28–29 two studies reporting no difference in D2R-BP,30–31 and one study reporting higher D2R-BP32 for RLS. Prior use of or acute withdrawal from DAergic medications would seem a likely confounding variable in the determination of D2R-BP and thus a variable that may bias the data.3 In addressing that point, we did a subanalysis involving only those patients with RLS who did not have prior DAergic treatment and found significantly lower D2R-BP values for the caudate region with a persistence of effect for at least the posterior putamen. Upon closer examination of the data, it is clear that there were minimal changes in the mean D2R-BP values between the all-RLS group and the DAergic-drug-naïve RLS group. What had changed was the sample size and thus the power to detect a difference. Using SPECT, Eisensehr et al.34 also assessed D2R-BP in drug-naïve and DAergic-pretreated (but off medications for the study) patients with RLS and found no difference in D2R-BP between patients with RLS and control patients. Perusal of the mean value between pretreated and drug-naïve, however, showed no meaningful difference between the two groups. In our study protocol, patients with RLS were off DAergic agents for at least 11 days prior to the PET study, whereas in the protocol by Eisensehr et al.,34 patients were off for only 2 days. It appears, therefore, that SPECT/PET striatal D2R-BP is relatively insensitive to acute or subacute withdrawal from DAergic agents and thus prior use may not account for the discrepancy seen across the different studies. Even if we analyze only the data derived from drug-naïve cases, we still have the current study and Michaud et al.28 reporting lower, Eisensehr et al.34 reporting no difference, and Cervenka et al.32 reporting a higher D2R-BP for patients with RLS.
Disease severity has been suggested to possibly account for the difference seen across the studies.3 One of the major consequences of RLS and an indicator of disease severity is sleep loss. Recent acute sleep loss for one night was found to be associated with decreased striatal D2R-BP using methods similar to that used in the current study.35 In the current study, however, no significant correlations were found between D2R-BP from any subregions and any of the primary or secondary measures of RLS disease including several measures of sleep quality. Two SPECT studies also failed to find any correlation between D2R-BP and clinical and polysomnographic measures of sleep quality.28,30 With regard to symptom severity per se, as the circadian variance in symptoms is such a distinct and quite dramatic clinical feature of the disease, one would have expected to see changes in D2R-BP between day and night scans, if D2R-BP was associated with underlying clinical pathology producing the symptoms. However, neither the current study nor Cervenka et al.32 found any significant diurnal difference in D2R-BP for either RLS or control groups. When looking across all the PET/SPECT striatal D2R-BP data, the most remarkable finding is how they do not relate to any aspect of RLS disease. Striatal D2R-BP as determined by PET/SPECT imaging is clearly, therefore, not associated with disease severity either because D2R-BP is too crude a measure of D2R function or there is, in fact, no change in striatal D2R directly related to RLS pathology. In addressing the latter point, autopsy data have shown a decrease in D2R density that did correlate significantly with symptom severity. The discrepancy between the autopsy findings and the imaging studies may lie in the differences between the two approaches. The autopsy technique for the determination of D2R uses tissue homogenate with immunoblot determination, which does not discriminate between intracellular and membrane-bound receptor, and thus reflects total cellular receptor concentrations. PET/SPECT imaging, on the other hand, reflects only membrane-bound receptors and, more importantly, D2R-BP, D2R-βmax, and -Kd as determined by PET/SPECT imaging are at best crude measures of receptor concentration and dynamics.
The D2R-BP as a defined outcome variable in PET studies reflects three interacting factors: the density of the receptors on the membrane (βmax), the receptor-ligand dissociation constant or receptor affinity (Kd), and the amount of extracellular dopamine.5–7 The βmax and Kd are considered to be the most relevant factors contributing to differences in D2R-BP,5 with some suggesting that D2R-BP is, in fact, a close approximation of βmax.7,32 Studies have shown that the current techniques used to estimate the βmax and apparent Kd for the striatal D2R are very reliable, giving reproducible results both within and across patients, even over months.5–6 The day-night differences in the ventral striatum D2R-βmax and -Kd seen in the current study also demonstrate that these measures are sensitive enough to detect changes in basic biologic factors (i.e., circadian fluctuations). As these measures appear to be reliable and sensitive, then the failure to find a difference between RLS and control for either βmax or Kd, suggests that the difference seen in D2R-BP cannot be adequately explained by changes in receptor affinity or density. In the absence of clear indication for a change in βmax or Kd to account for the change in D2R-BP, then the remaining third contributing factor, intrasynaptic dopamine, becomes a more likely candidate.
Agents that increase or decrease intrasynaptic dopamine have been shown to alter raclopride binding to striatal D2R.36–37 Therefore, changes in D2R-BP can reflect differences in synaptic dopamine. In fact, changes in PET-determined striatal D2R-BP with sleep deprivation have been suggested to be linked to increase presynaptic DAergic activity.35,38 There are several lines of investigation that suggest the presynaptic DAergic activity may be increased in RLS and thus could result in an increase in synaptic DA. Cerebrospinal fluid analysis in patients with RLS has found an increase in 3-O-methyldopa,39 which is found as a by-product of catechol-O-methyltransferase metabolism of l-DOPA when the latter is in excess.40 One interpretation of the cerebrospinal fluid is that it represented an increase in tyrosine hydroxylase (TH) activity and l-DOPA production.39 In support of that concept is the finding of increased total TH and in the more enzymatic active form, phosphorylated TH, in the autopsy brains of patients with RLS.4 Two PET studies using 18F-dopa to assess presynaptic DAergic activity29,41 reported a small decrease in putamen activity for the RLS group. Although the authors' interpretation was a decreased uptake,29,41 the other equally and most likely interpretation is increased release and turnover 3 given the lack of any indication for dysfunction or neurodegeneration within the nigrostriatal pathway of patients with RLS.4,42 Recent PET studies of the dopamine transport in the striatum of those with RLS have reported a decrease in dopamine transport,43 which might be expected to increase synaptic dopamine concentrations. Given the lack of any difference in either βmax or Kd and the prior studies supporting an increase in presynaptic DAergic activity, the current changes found in D2R-BP likely reflect an increase in synaptic dopamine.
One of the more significant findings in this study is the pronounced change in the ventral striatum seen with time of day. Circadian changes in receptor density have been well documented in animal studies.44 A peak in striatal D2R density (βmax) but not affinity at the end of the activity period has been reported by several investigators.45–46 There have been, however, only two studies that have assessed diurnal differences in human striatal D2R-BP and, as in our study, no differences were found.32,47 There have been no studies, however, that have looked at diurnal changes in either D2R-βmax or -Kd; therefore, this is the first study to make that assessment and the first to demonstrate a clear diurnal variation in ventral striatal D2R-Bmax and -Kd. The clinical significance of the finding is unclear, other then to say it does not relate to RLS or to standard polysomnographic measures of sleep.
In the final analysis, when the current data are assessed within the context of all the prior PET/SPECT D2R-BP data, the most obvious conclusion is that the D2R-BP bears no relation to important clinical markers of disease status, thus making any reported differences in this measure of questionable value in understanding the pathophysiology of the disease.
DISCLOSURE STATEMENT
This was not an industry supported study. Dr. Kuwabara has participated in research studies sponsored by Roche, Sanofi-Aventis, Otsuka, and Lilly. Dr. Wong has received research support from Avid, GE, Intracellular, Lilly, Lundbeck, Merck, Orexigen Therapeutics, Otsuka, Roche, and Sanofi-Aventis. Dr. Allen has consulted for or received research support from GlaxoSmithKline and Pharmacosmos, served as a consultant for Xenoport, Boehringer-Ingelheim, Jazz, UCB, Orion, Novartis, Pfizer, EMD-Serono, Neurogen, and Luitpold Pharmaceuticals. The other authors have indicated no financial conflicts of interest.
ACKNOWLEDGMENTS
The authors thank David J. Clough and Daniel P. Holt for technical support and effort in PET scanning and radiochemical synthesis.This research was supported by several grants from National Institutes of Health [M01-RR00052, M01-RR02719, R01-NS42857 to Dr. Earley, PO1-AG21190 to Dr. Earley, and K24 DA000412 to Dr.Wong].
REFERENCES
- 1.Allen RP, Walters AS, Montplaisir J, et al. Restless legs syndrome prevalence and impact: REST general population study. Arch Intern Med. 2005;165:1286–92. doi: 10.1001/archinte.165.11.1286. [DOI] [PubMed] [Google Scholar]
- 2.Earley CJ, Allen RP, Beard JL, Connor JR. Insight into the pathophysiology of restless legs syndrome. J Neurosci Res. 2000;62:623–8. doi: 10.1002/1097-4547(20001201)62:5<623::AID-JNR1>3.0.CO;2-H. [DOI] [PubMed] [Google Scholar]
- 3.Trenkwalder C, Earley CJ. Neuroimaging in Restless Legs Syndrome. In: Hening WA, Allen RP, Chokroverty S, Earley CJ, editors. Restless Legs Syndrome. Philadelphia: Saunders Elsevier; 2009. pp. 78–82. [Google Scholar]
- 4.Connor JR, Wang XS, Allen RP, et al. Altered dopaminergic profile in the putamen and substantia nigra in restless leg syndrome. Brain. 2009;132:2403–12. doi: 10.1093/brain/awp125. [DOI] [PMC free article] [PubMed] [Google Scholar]
- 5.Farde L, Hall H, Pauli S, Halldin C. Variability in D2-dopamine receptor density and affinity: a PET study with [11C]raclopride in man. Synapse. 1995;20:200–8. doi: 10.1002/syn.890200303. [DOI] [PubMed] [Google Scholar]
- 6.Hietala J, Nagren K, Lehikoinen P, Ruotsalainen U, Syvalahti E. Measurement of Striatal D2 Dopamine Receptor Density and Affinity with [11C]-Raclopride in Vivo: A Test-Retest Analysis. J Cereb Blood Flow Metab. 1999;19:210–7. doi: 10.1097/00004647-199902000-00012. [DOI] [PubMed] [Google Scholar]
- 7.Laruelle M. Dopamine transmission in the schizophrenic brain. In: Hirsch S, Weinberger D, editors. Schizophrenia. Oxford: Blackwell; 2003. pp. 365–87. [Google Scholar]
- 8.Allen RP, Earley CJ. Restless legs syndrome: a review of clinical and pathophysiologic features. J Clin Neurophysiol. 2001;18:128–47. doi: 10.1097/00004691-200103000-00004. [DOI] [PubMed] [Google Scholar]
- 9.Lynoe N, Sandlund M, Dahlqvist G, Jacobsson L. Informed consent: study of quality of information given to participants in a clinical trial. Bmj. 1991;303:610–3. doi: 10.1136/bmj.303.6803.610. [DOI] [PMC free article] [PubMed] [Google Scholar]
- 10.Hening WA, Allen RP, Washburn M, Lesage S, Earley CJ. Validation of the Hopkins telephone diagnostic interview for restless legs syndrome. Sleep Medicine. 2008;9:283–9. doi: 10.1016/j.sleep.2007.04.021. [DOI] [PubMed] [Google Scholar]
- 11.Allen RP, Picchietti D, Hening WA, Trenkwalder C, Walters AS, Montplaisir J. Restless legs syndrome: diagnostic criteria, special considerations, and epidemiology. A report from the restless legs syndrome diagnosis and epidemiology workshop at the National Institutes of Health. Sleep Med. 2003;4:101–19. doi: 10.1016/s1389-9457(03)00010-8. [DOI] [PubMed] [Google Scholar]
- 12.Allen RP, Hening WA. Actigraph assessment of periodic leg movements and restless legs syndrome. In: Hening WA, Allen RP, Chokroverty S, Earley CJ, editors. Restless Legs Syndrome. Philadelphia: Saunders Elsevier; 2009. pp. 142–9. [Google Scholar]
- 13.Earley CJ, Horska A, Mohamed MA, Barker PB, Beard JL, Allen RP. A randomized, double-blind, placebo-controlled trial of intravenous iron sucrose in restless legs syndrome. Sleep Med. 2009;10:206–11. doi: 10.1016/j.sleep.2007.12.006. [DOI] [PMC free article] [PubMed] [Google Scholar]
- 14.Hilton J, Yokoi F, Dannals RF, Ravert HT, Szabo Z, Wong DF. Column-switching HPLC for the analysis of plasma in PET imaging studies. Nucl Med Biol. 2000;27:627–30. doi: 10.1016/s0969-8051(00)00125-6. [DOI] [PubMed] [Google Scholar]
- 15.DeGrado TR, Turkington TG, Williams JJ, Stearns CW, Hoffman JM, Coleman RE. Performance characteristics of a whole-body PET scanner. J Nucl Med. 1994;35:1398–406. [PubMed] [Google Scholar]
- 16.Ehrin E, Farde L, de Paulis T, et al. Preparation of 11C-labelled Raclopride, a new potent dopamine receptor antagonist: preliminary PET studies of cerebral dopamine receptors in the monkey. Int J Appl Radiat Isot. 1985;36:269–73. doi: 10.1016/0020-708x(85)90083-3. [DOI] [PubMed] [Google Scholar]
- 17.Oswald LM, Wong DF, McCaul M, et al. Relationships among ventral striatal dopamine release, cortisol secretion, and subjective responses to amphetamine. Neuropsychopharmacology. 2005;30:821–32. doi: 10.1038/sj.npp.1300667. [DOI] [PubMed] [Google Scholar]
- 18.Mawlawi O, Martinez D, Slifstein M, et al. Imaging human mesolimbic dopamine transmission with positron emission tomography: I. Accuracy and precision of D(2) receptor parameter measurements in ventral striatum. J Cereb Blood Flow Metab. 2001;21:1034–57. doi: 10.1097/00004647-200109000-00002. [DOI] [PubMed] [Google Scholar]
- 19.Martinez D, Slifstein M, Broft A, et al. Imaging human mesolimbic dopamine transmission with positron emission tomography. Part II: amphetamine-induced dopamine release in the functional subdivisions of the striatum. J Cereb Blood Flow Metab. 2003;23:285–300. doi: 10.1097/01.WCB.0000048520.34839.1A. [DOI] [PubMed] [Google Scholar]
- 20.Baumann B, Danos P, Krell D, et al. Reduced volume of limbic system-affiliated basal ganglia in mood disorders: preliminary data from a postmortem study. J Neuropsychiatry Clin Neurosci. 1999;11:71–8. doi: 10.1176/jnp.11.1.71. [DOI] [PubMed] [Google Scholar]
- 21.Ashburner JT, Friston KJ. Rigid body registration. In: Friston KJ, Ashburner JT, Kiebel SJ, Nichols TE, editors. Statistical Parametric Mapping: The Analysis of Functional Brain Images. Boston: Academic Press; 2007. pp. 49–62. [Google Scholar]
- 22.Ichise M, Liow JS, Lu JQ, et al. Linearized reference tissue parametric imaging methods: application to [11C]DASB positron emission tomography studies of the serotonin transporter in human brain. J Cereb Blood Flow Metab. 2003;23:1096–112. doi: 10.1097/01.WCB.0000085441.37552.CA. [DOI] [PubMed] [Google Scholar]
- 23.Kuwabara H, McCaul ME, Wand GS, et al. Dissociative changes in Bmax and KD of dopamine D2/D3 receptors with aging observed in functional subdivisions of striatum: A revisit with an improved data analysis method. Journal of Nuclear Medicine. 2012 doi: 10.2967/jnumed.111.098186. In Press. [DOI] [PMC free article] [PubMed] [Google Scholar]
- 24.Carson RE, Channing MA, Blasberg RG, et al. Comparison of bolus and infusion methods for receptor quantitation: application to [18F]cyclofoxy and positron emission tomography. J Cereb Blood Flow Metab. 1993;13:24–42. doi: 10.1038/jcbfm.1993.6. [DOI] [PubMed] [Google Scholar]
- 25.Staedt J, Stoppe G, Kogler A, et al. Dopamine D2 receptor alterations in patients with periodic movements in sleep (nocturnal myoclonus) J Neural Transm Gen Sect. 1993;93:71–4. doi: 10.1007/BF01244940. [DOI] [PubMed] [Google Scholar]
- 26.Staedt J, Stoppe G, Kogler A, et al. Single photon emission tomography (SPET) imaging of dopamine D2 receptors in the course of dopamine replacement therapy in patients with nocturnal myoclonus syndrome (NMS) J Neural Transm Gen Sect. 1995;99:187–93. doi: 10.1007/BF01271478. [DOI] [PubMed] [Google Scholar]
- 27.Staedt J, Stoppe G, Kogler A, et al. Nocturnal myoclonus syndrome (periodic movements in sleep) related to central dopamine D2-receptor alteration. Eur Arch Psychiatry Clin Neurosci. 1995;245:8–10. doi: 10.1007/BF02191538. [DOI] [PubMed] [Google Scholar]
- 28.Michaud M, Soucy JP, Chabli A, Lavigne G, Montplaisir J. SPECT imaging of striatal pre- and postsynaptic dopaminergic status in restless legs syndrome with periodic leg movements in sleep. J Neurol. 2002;249:164–70. doi: 10.1007/pl00007859. [DOI] [PubMed] [Google Scholar]
- 29.Turjanski N, Lees AJ, Brooks DJ. Striatal dopaminergic function in restless legs syndrome: 18F-dopa and 11C-raclopride PET studies. Neurology. 1999;52:932–7. doi: 10.1212/wnl.52.5.932. [DOI] [PubMed] [Google Scholar]
- 30.Eisensehr I, Wetter TC, Linke R, et al. Normal IPT and IBZM SPECT in drug-naive and levodopa-treated idiopathic restless legs syndrome. Neurology. 2001;57:1307–9. doi: 10.1212/wnl.57.7.1307. [DOI] [PubMed] [Google Scholar]
- 31.Tribl GG, Asenbaum S, Klosch G, et al. Normal IPT and IBZM SPECT in drug naive and levodopa-treated idiopathic restless legs syndrome (letter to editor) Neurology. 2002;59:649–50. doi: 10.1212/wnl.59.4.649. [DOI] [PubMed] [Google Scholar]
- 32.Cervenka S, Palhagen SE, Comley RA, et al. Support for dopaminergic hypoactivity in restless legs syndrome: a PET study on D2-receptor binding. Brain. 2006;129:2017–28. doi: 10.1093/brain/awl163. [DOI] [PubMed] [Google Scholar]
- 33.Wong DF, Wagner HN, Dannals R, et al. Effects of age on dopamine and serotonin receptors measured by positron tomography in the living human brain. Science. 1984;226:1393–6. doi: 10.1126/science.6334363. [DOI] [PubMed] [Google Scholar]
- 34.Eisensehr I, Ehrenberg BL, Noachtar S. Different sleep characteristics in restless legs syndrome and periodic limb movement disorder. Sleep Med. 2003;4:147–52. doi: 10.1016/s1389-9457(03)00004-2. [DOI] [PubMed] [Google Scholar]
- 35.Volkow ND, Wang G-J, Telang F, et al. Sleep deprivation decreases binding of [11C]raclopride to dopamine D2/D3 receptors in the human brain. J Neurosci. 2008;28:8454–61. doi: 10.1523/JNEUROSCI.1443-08.2008. [DOI] [PMC free article] [PubMed] [Google Scholar]
- 36.Laruelle M. Imaging synaptic neurotransmission with in vivo binding competition techniques: a critical review. J Cereb Blood Flow Metab. 2000;20:423–51. doi: 10.1097/00004647-200003000-00001. [DOI] [PubMed] [Google Scholar]
- 37.Verhoeff NP, Kapur S, Hussey D, et al. A simple method to measure baseline occupancy of neostriatal dopamine D2 receptors by dopamine in vivo in healthy subjects. Neuropsychopharmacology. 2001;25:213–23. doi: 10.1016/S0893-133X(01)00231-7. [DOI] [PubMed] [Google Scholar]
- 38.Volkow ND, Tomasi D, Wang G-J, et al. Hyperstimulation of striatal D2 receptors with sleep deprivation: Implications for cognitive impairment. NeuroImage. 2009;45:1232–40. doi: 10.1016/j.neuroimage.2009.01.003. [DOI] [PMC free article] [PubMed] [Google Scholar]
- 39.Earley CJ, Hyland K, Allen RP. Circadian changes in CSF dopaminergic measures in restless legs syndrome. Sleep Med. 2006;7:263–8. doi: 10.1016/j.sleep.2005.09.006. [DOI] [PubMed] [Google Scholar]
- 40.Cooper JR, Bloom FE, Roth RH. The Biochemical Basis of Neuropharmacology. 8th ed. New York: Oxford University Press; 2003. [Google Scholar]
- 41.Ruottinen HM, Partinen M, Hublin C, et al. An FDOPA PET study in patients with periodic limb movement disorder and restless legs syndrome. Neurology. 2000;54:502–4. doi: 10.1212/wnl.54.2.502. [DOI] [PubMed] [Google Scholar]
- 42.Connor JR, Boyer PJ, Menzies SL, Dellinger B, Allen RP, Earley CJ. Neuropathological examination suggests impaired brain iron acquisition in restless legs syndrome. Neurology. 2003;61:304–9. doi: 10.1212/01.wnl.0000078887.16593.12. [DOI] [PubMed] [Google Scholar]
- 43.Earley CJ, Kuwabara H, Wong DF, et al. The dopamine transporter is decreased in the striatum of subjects with restless legs syndrome. Sleep. 2011;34:341–7. doi: 10.1093/sleep/34.3.341. [DOI] [PMC free article] [PubMed] [Google Scholar]
- 44.Wirz-Justice A. Circadian rhythms in mammalian neurotransmitter receptors. Prog Neurobiol. 1987;29:219–59. doi: 10.1016/0301-0082(87)90022-0. [DOI] [PubMed] [Google Scholar]
- 45.Planeta CS, DeLucia R, Aizenstein ML, Oliveira GH. Daily variation in plasma concentration of fencamfamine and striatal dopamine receptors in rats. Braz J Med Biol Res. 1994;27:737–41. [PubMed] [Google Scholar]
- 46.Akhisaroglu M, Kurtuncu M, Manev H, Uz T. Diurnal rhythms in quinpirole-induced locomotor behaviors and striatal D2/D3 receptor levels in mice. Pharmacol Biochem Behav. 2005;80:371–7. doi: 10.1016/j.pbb.2004.11.016. [DOI] [PubMed] [Google Scholar]
- 47.Červenka S, Halldin C, Farde L. Age-related diurnal effect on D2 receptor binding: a preliminary PET study. The International Journal of Neuropsychopharmacology. 2008;11:671–8. doi: 10.1017/S1461145707008358. [DOI] [PubMed] [Google Scholar]