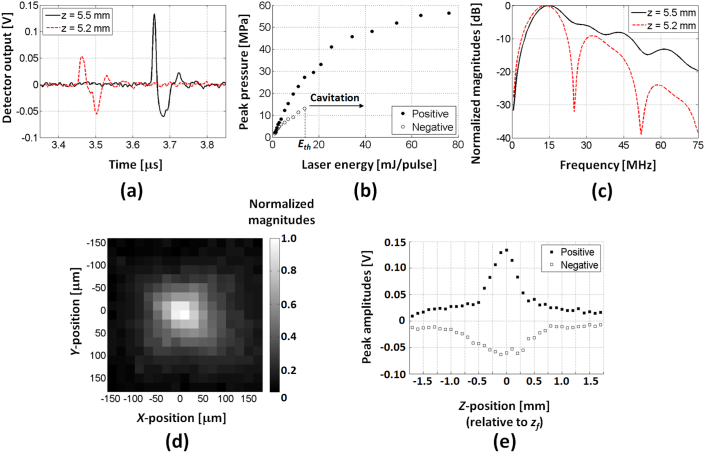
Figure 2. Temporal and spatial characterization of the LGFU.
(a) Time-domain waveforms around the lens focus (z = 5.5 mm) and slightly in front of the focal point (z = 5.2 mm); (b) Measured pressure amplitudes versus laser energy at focal point (z = 5.5 mm); (c) Frequency spectra for the waveforms shown in (a).Note that the sensitivity of fiber hydrophone is ~6 mV/MPa (details in the experimental section). The negative amplitudes in (b) could be correctly determined only under a sub-threshold regime of acoustic cavitation. The laser energy for the cavitation threshold is denoted as Eth; (d) Spatial profile of the LGFU on the lateral plane at z = 5.5 mm. The peak amplitudes were normalized, and the image was obtained from the positive peaks; (e) Axial profile along the z-direction. Here, the z-position was relatively defined from z = zf = 5.5 mm, i.e. z < 0 means the fiber hydrophone position between the lens surface and the focus, and z > 0 beyond the focus. Step resolutions are 20 μm in (d) and 100 μm in (e). The laser energy of ~12 mJ/pulse on the lens surface was used for (a), (c), (d), and (e) (laser fluence = 42.4 mJ/cm2/pulse).

