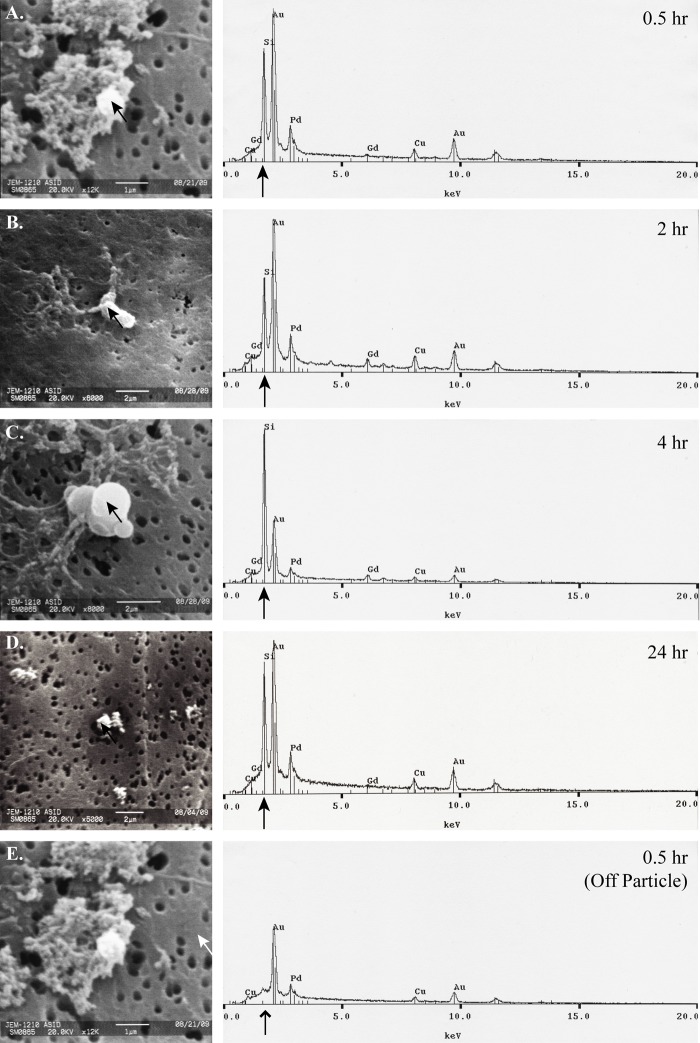
Figure 2.
Acid-prepared mesoporous spheres (APMS)–gadolinium (Gd) microparticles are excreted in the urine. Urine samples were passively collected from Wistar rats (n=3) following each MRI time point (0.5, 2, 4, 24 hr). Urine samples were digested, filtered, and prepared for scanning electron microscopy (SEM)/energy dispersive spectroscopy (EDS) analysis with gold and palladium coating. Panels A to D present SEM micrographs (left) of APMS-Gd microparticles (indicated by black arrows). In panels A and E, magnification is 12,000×, scale bar = 1 µm. B and C are at 8000× magnification; scale bar = 2 µm. D is at 5000× magnification; scale bar = 2 µm. The corresponding EDS spectra (right) display prominent silicon peaks (black arrows), the main component of APMS microparticles. Panel E represents an off-target (white arrow) SEM micrograph control. The corresponding EDS spectrum reveals an absence of silicon (line arrow). No particles could be found for analysis in the 144-hr (6-day) sample.

