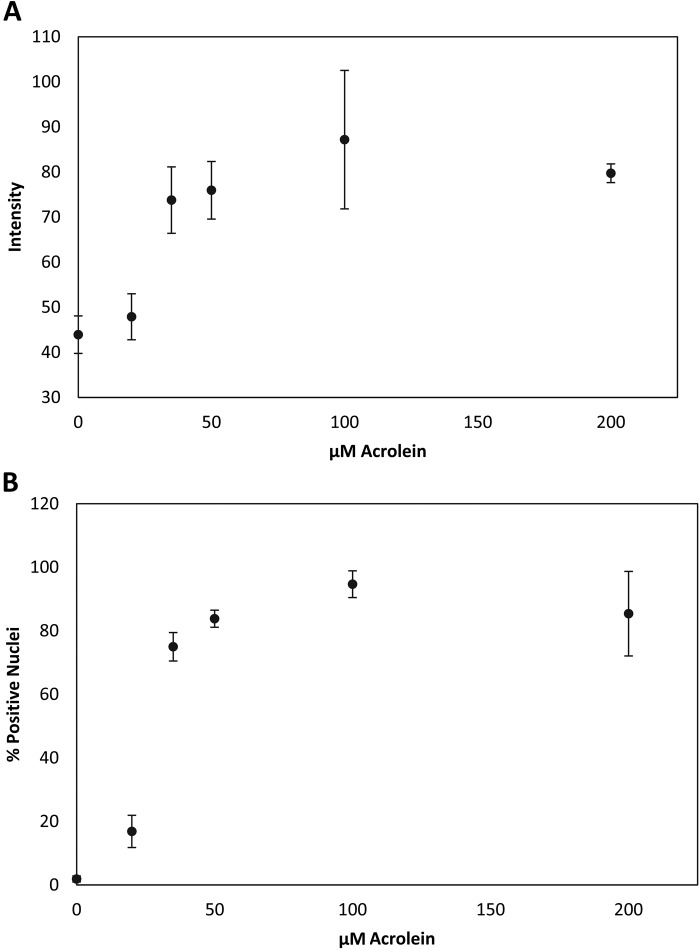
Figure 4.
MetaMorph quantification of Acr-dG immunofluorescence. BEAS-2B cells were treated with varying concentrations of Acr for 24 hr as described in Materials and Methods. (A) Acr-dG immunofluorescence intensity. Dots, average of triplicate experiments; bars, standard error of the mean. (B) Percentage of positively stained nuclei for Acr-dG. Dots, average of triplicate experiments; bars, standard error of the mean.

