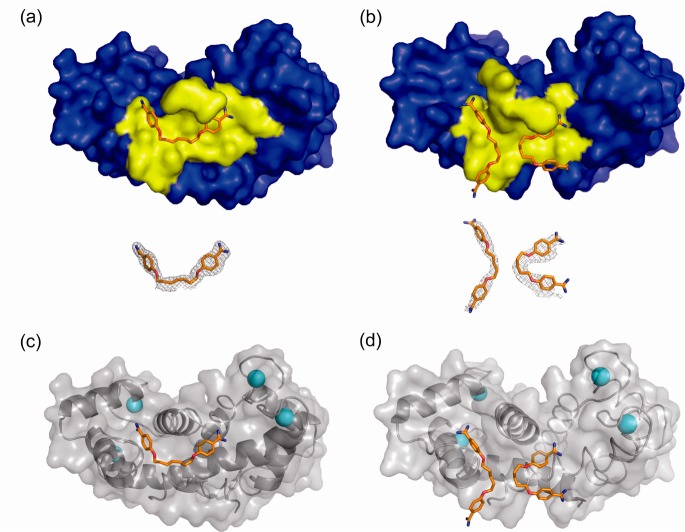
Figure 3.
High-resolution crystal structures of S100B bound to heptamidine and pentamidine. (a and b) Surface representation of the structure of S100B bound to heptamidine (a) and pentamidine (b). Residues within 3 Å are colored yellow to highlight the binding pocket. Below, the electron density maps calculated with the 2mFo – DFc coefficients (contoured at 1.0σ) for each compound are shown. The atoms of the compound are colored orange (carbon), blue (nitrogen), and red (oxygen). (c and d) Cartoon representation of the structure of S100B bound to heptamidine (c) and pentamidine (d) with helices visible. Compounds are colored as in a and b, and calcium ions are depicted as cyan spheres.

