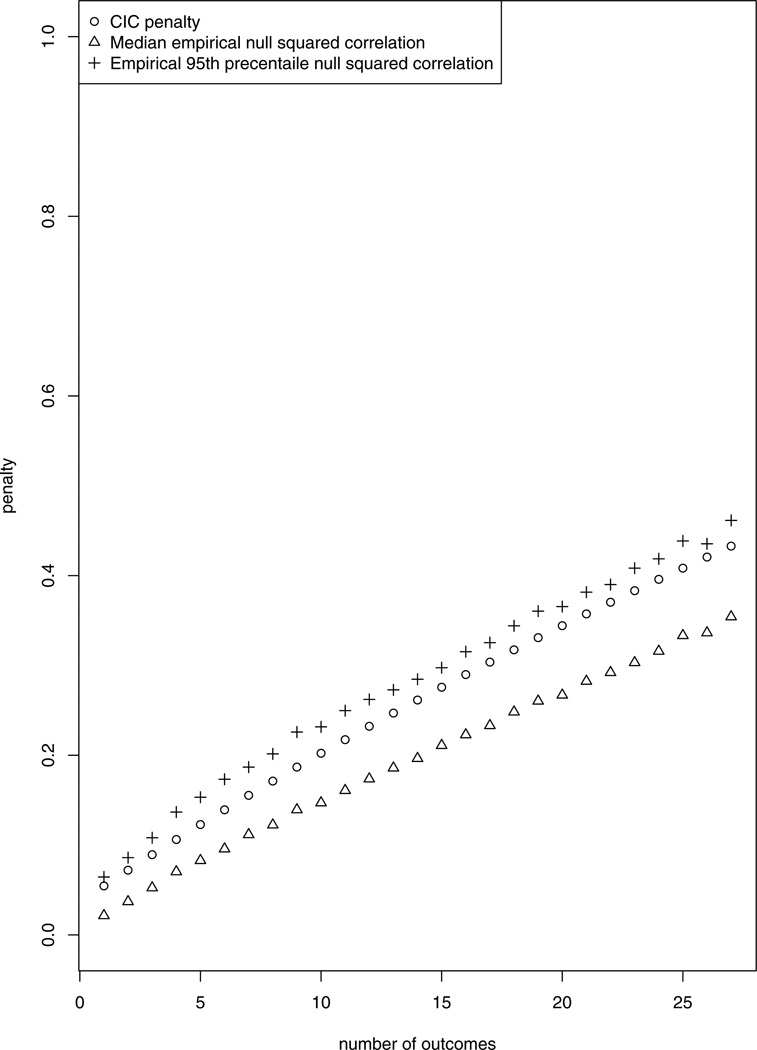
Fig. 1.
The CIC penalty (circles) and the median (triangles) and 95th percentile (crosses) of the empirical distribution of the square of the estimated canonical correlation from 1000 simulations conducted under independence between normally distributed outcomes and exposures. The number of samples is 92, the number of exposure variables is 2 and the number of outcomes is between 1 to 27, mimicking the asthma pathway.

