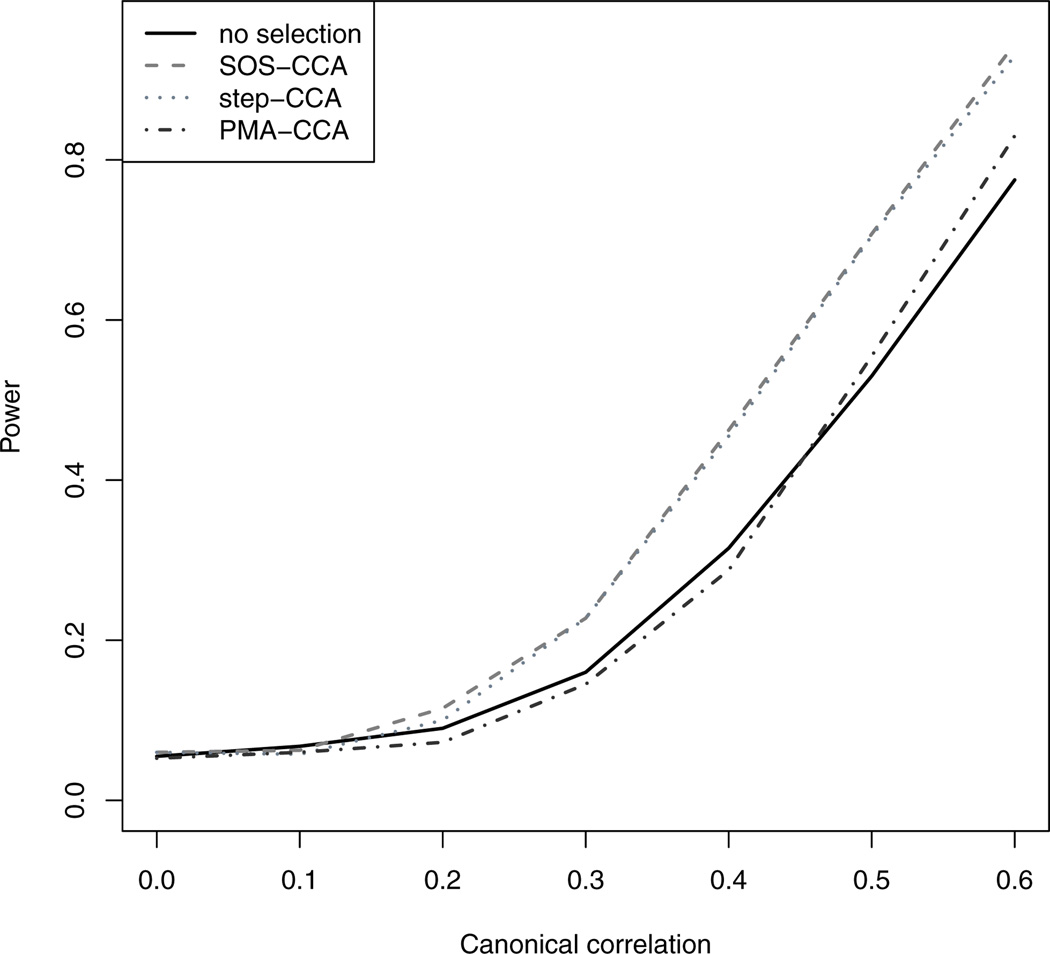
Fig. 2.
Simulation results of size and power as a function of between-outcome correlation. The type I error was set at the 0.05 level. Four tests were compared. For SOS-CCA and Step-CCA, we considered the proposed Wilks’ Λ based tests. For PMA-CCA, we considered the canonical correlation based test of [23]. We also included the regular test without gene selection. For all of the methods, CIC was used as the model selection criteria.

