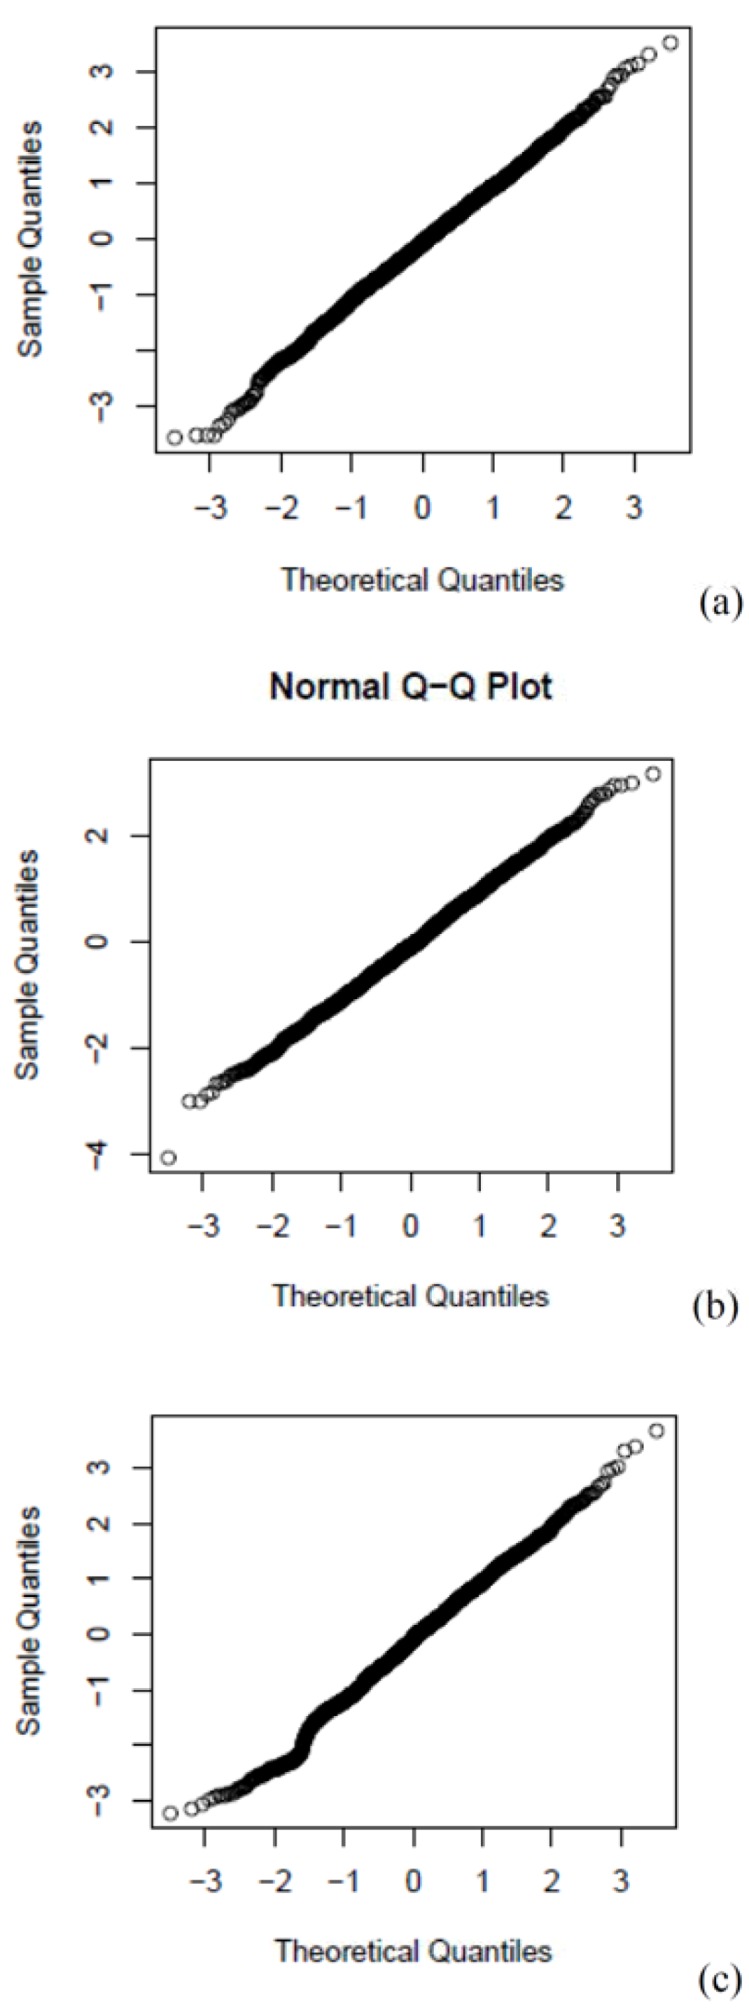
Figure A10.

Normal Q-Q plot for the generalised additive Poisson time-series regression models (entire year): RD (a), CVD (b) and CBD (c) mortality in Cape Town, South Africa during 2001–2006. Adjusted for the 2-day cumulative average of PM10, NO2 or SO2, and long term seasonal trends, public holidays, day of the week, 2-day cumulative averages of 24-h apparent temperature, wind and rain. K = 30 for time, i.e. 5df/year.
