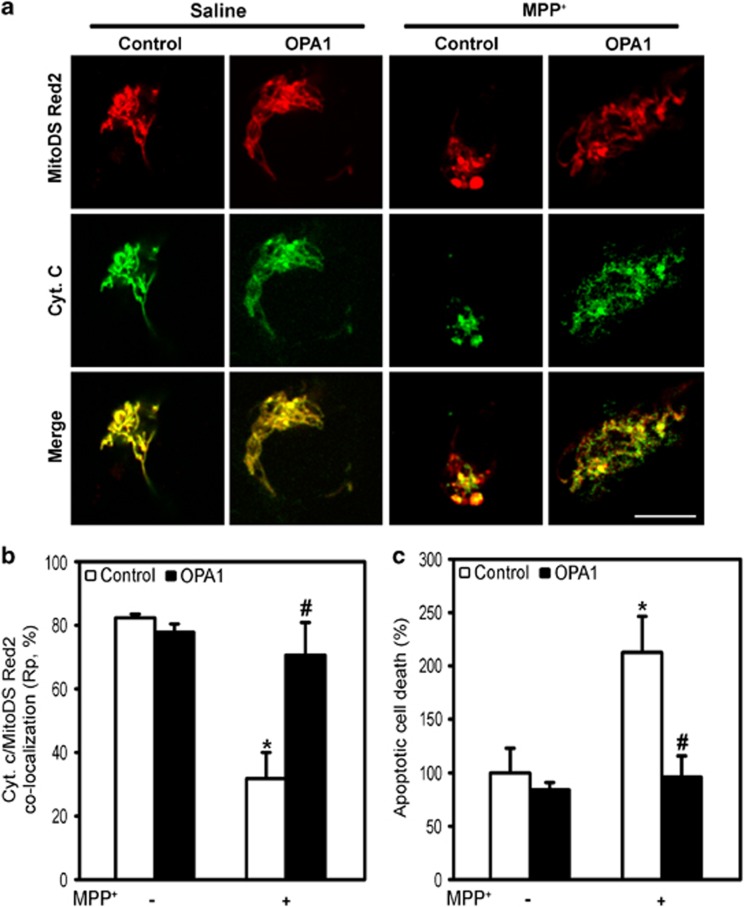
Figure 4.
OPA1 overexpression attenuates cytochrome c release and cell death linked to complex I inhibition. (a) Representative images of cytochrome c subcellular distribution (in green; red corresponds to mito-DsRed2-labeled mitochondria) in control (empty vector) and OPA1-overexpressing SH-SY5Y neuroblastoma cells treated with saline or MPP+. (b) Pearson's colocalization coefficients (Rp) between cytochrome c and mito-DsRed2-labeled mitochondria in the different experimental groups. At least three representative fields containing an average of 45 cells/field were analyzed per group. (c) Cell death determined by flow cytometry after propidium iodide staining in control (empty vector) and OPA1-overexpressing SH-SY5Y cells treated with saline or MPP+. Histograms represent average±S.E.M. from at least three independent experiments. MPP+, 5 mM for 24 h; *P<0.05, compared with untreated cells; #P<0.05, compared with MPP+-treated control (empty vector) cells. Scale bar, 10 μm

