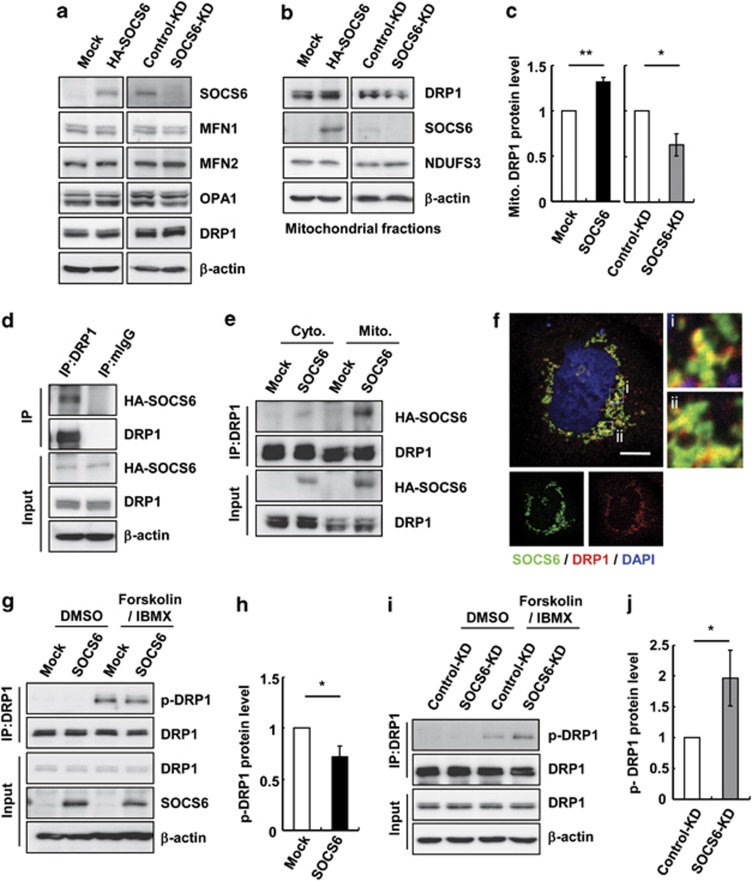
Figure 7.
SOCS6 forms a complex with DRP1, attenuates DRP1 phosphorylation, and promotes DRP1 mitochondrial translocation. HeLa cells transiently transfected with pcDNA3 or pcDNA-SOCS6 and the cells stably harboring lentivirus-based shRNA targeting luciferase or SOCS6 were examined. (a) Total cell lysates were prepared and subjected to immunoblotting against the indicated proteins. (b and c) Mitochondria were purified and subjected to western blot analysis (b). The bar graph in (c) shows the quantification of the DRP1 protein level in the mitochondrial fraction. Data were derived from three separate experiments and are presented as the means±S.E.M. *P<0.05 and **P<0.01 by Student's t-test. (d) Cell lysates were prepared and subjected to immunoprecipitation with the control IgG or anti-DRP1 beads followed by western blot analysis of the immunoprecipitates using the indicated antibodies. (e) The cytosolic and mitochondrial fractions were isolated and subjected to immunoprecipitation followed by western blot analysis. (f) Confocal images of HA-SOCS6 (green, anti-SOCS6) and endogenous DRP1 (red, anti-DRP1) in HeLa cells expressing HA-SOCS6. Scale bar: 10 μm. Insets show enlarged views of the boxed areas. (g–j) Mock- or HA-SOCS6-expressing cells in (g and h) and control-KD or SOCS6-KD cells in (i and j) were incubated in the presence or absence of 20 μM forskolin and 10 μM IBMX for 1 h, and subjected to immunoprecipitation using a DRP1 antibody followed by immunoblotting against a phospho-DRP1(Ser637) antibody and the indicated antibodies in (g and i). Bar graphs in (h and j) show the quantification of phospho-DRP1 protein levels in cells treated with or without forskolin and IBMX. Data were derived from three separate experiments and are presented as the means±S.E.M. *P<0.05 by Student's t-test

