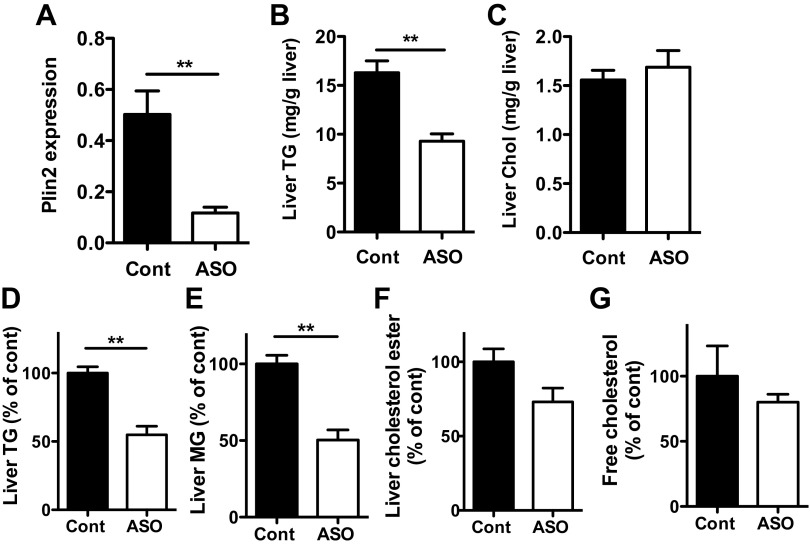
Fig. 1.
Mice on high-fat diet (HF) were treated for 4 wk with Plin2-ASO or control oligo (Cont). A: Plin2 mRNA in the liver was determined by qPCR. Enzymatic colorimetric assay comparing liver triglycerides (TG) (B) and liver cholesterol (Chol) (C) levels. Liver lipids were also separated and quantified by TLC. D: TG, E: monoglycerides (MG), F: cholesterol ester, and G: free cholesterol. Data are means ± SE, n = 5 per group. **P < 0.01 vs. Cont.

