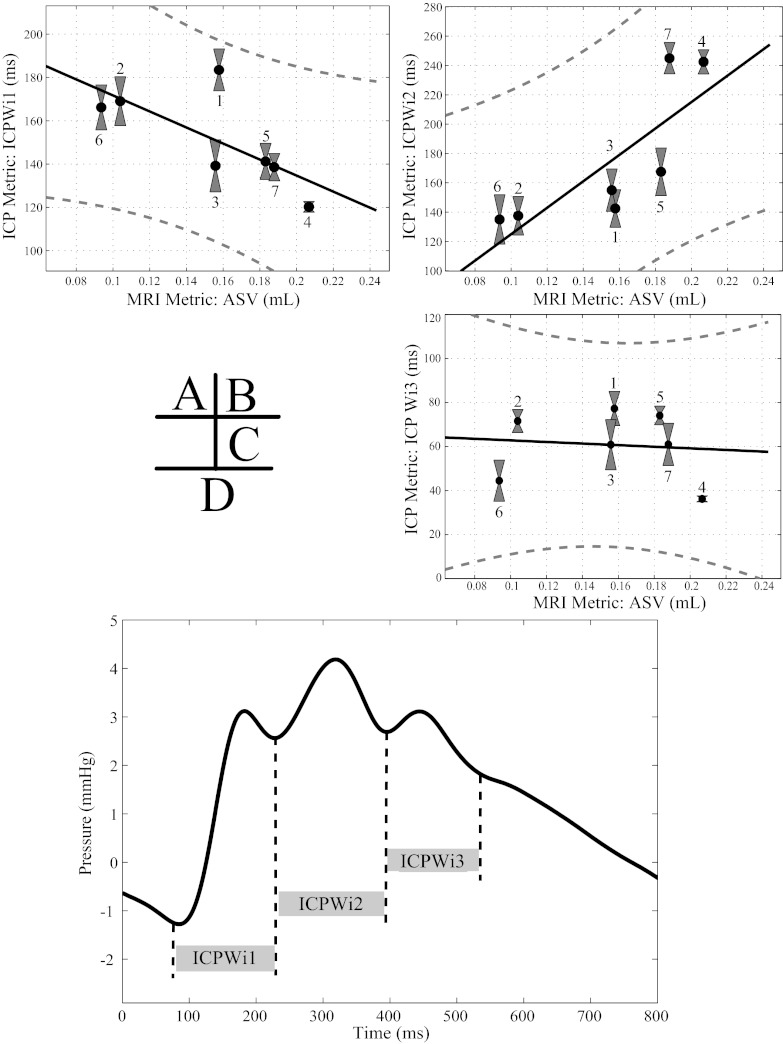
Fig. 2.
Intracranial pulse (ICP) temporal metrics correlations with MRI aqueductal stroke volume (ASV). Plots with linear fit and 95% prediction interval: ICP-Wi1 vs. ASV (A), ICP-Wi2 vs. ASV (B) ICP-Wi3 vs. ASV (C). D: a sample ICP pulse pressure waveform with the corresponding temporal width metrics are shown graphically. On A–C, gray boxes show the standard deviation of the overnight ICP metrics along with the unique patient index defined in Table 1.

