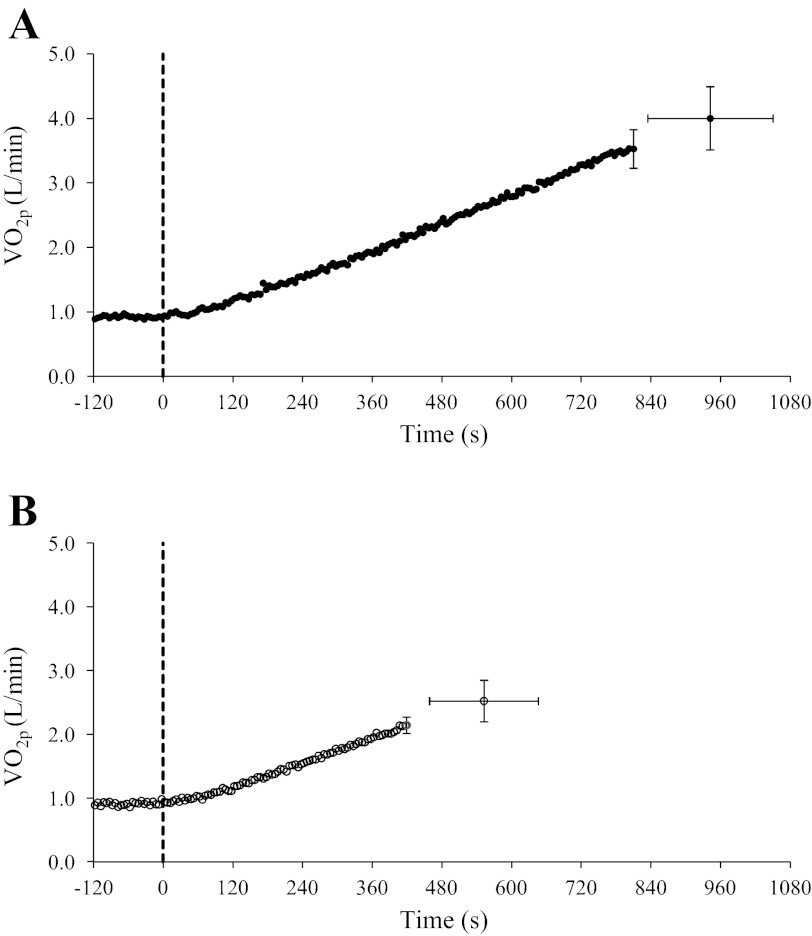
Fig. 1.
Group mean (±SD) pulmonary O2 consumption (V̇o2p) response profiles during ramp incremental (RI) exercise as a function of time (in s) for young adults (YA; A, ●) and older adults (OA; B, ○). Continuous curves represent mean values for all subjects; single points represent group mean (±SD) values at the point of fatigue during RI exercise. The dashed line indicates the onset of RI exercise.

