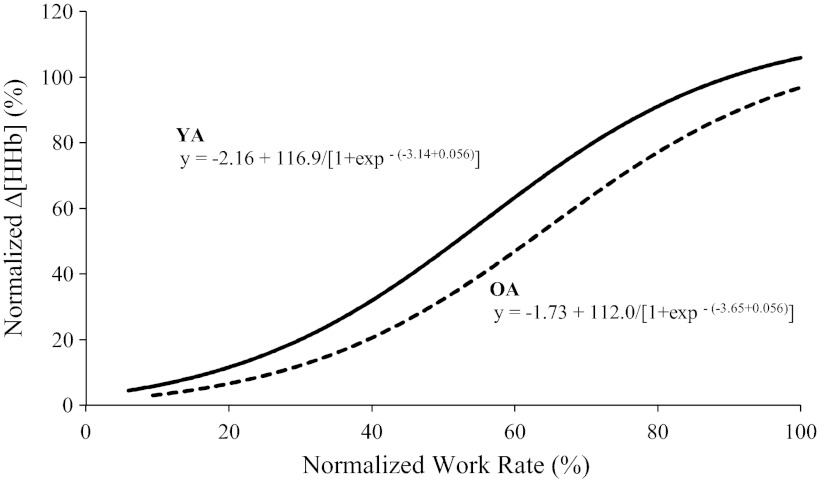
Fig. 4.
Sigmoid models of normalized Δ[HHb] (percentage of the peak amplitude during RI exercise) as a function of relative (percent peak) WR for the group mean for YA (solid line, ●) and OA (dashed line, ○). Sigmoid models were recreated from the parameters shown in Table 2.

