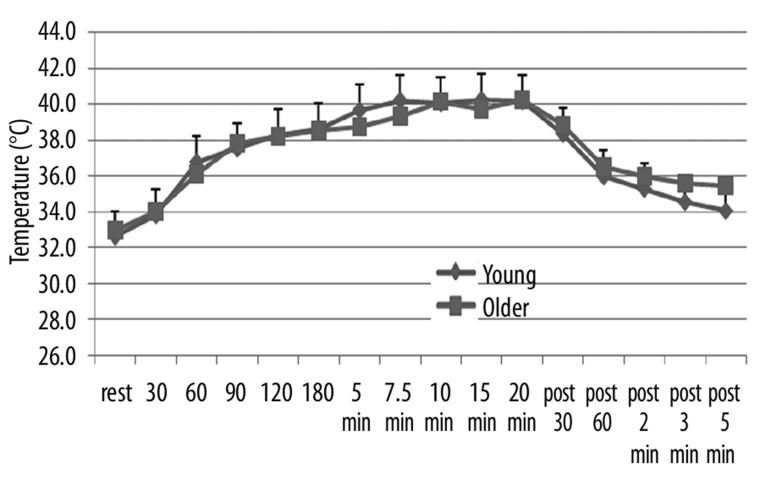
Figure 2.
Illustrated here is the skin temperature (in °C) measured at rest and at 30, 60, 90, 120, 180 seconds after exposure to heat and at 5, 7.5, 10, 15, and 20 minutes after exposure to heat and for 5 minutes after the heat was removed with measurements at 30 sec, 60 sec, 2 min, 3 min and 5 min as the average of 10 younger (diamonds) and 10 older (squares). Each point is the mean ± the respective standard deviation.

