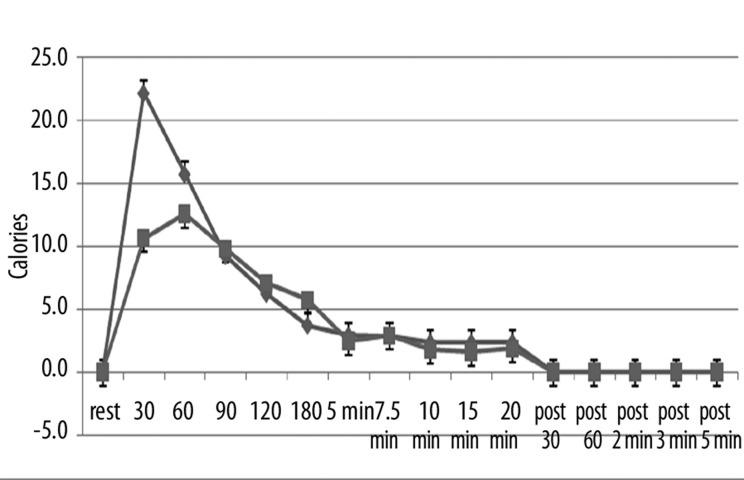
Figure 3.
Illustrated here is the thermal heat transfer (in calories) measured at rest and at 30, 60, 90, 120, 180 seconds after exposure to heat and at 5, 7.5, 10, 15, and 20 minutes after exposure to heat and for 5 minutes after the heat was removed with measurements at 30 sec, 60 sec, 2 min, 3 min and 5 min as the average of 10 younger (diamonds) and 10 older (squares). Each point is the mean ± the respective standard deviation.

