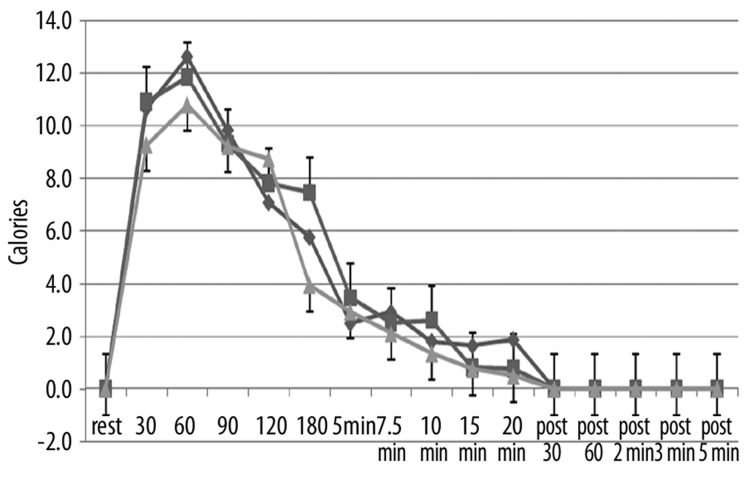
Figure 9.
Illustrated here is the thermal heat transfer (in calories) in the older group of subjects measured at rest and at 30, 60, 90, 120, 180 seconds after application of heat and at 5, 7.5, 10, 15, and 20 minutes after application of heat and well as at 30 sec, 60 sec, 2 min, 3 min and 5 min post removal of the heat. Data is shown for the 1st day (diamonds), the 2nd day of heat exposure (squares), and the 3rd day of heat exposure (triangles). Each point illustrates the mean of 10 subjects ± the respective standard deviations.

