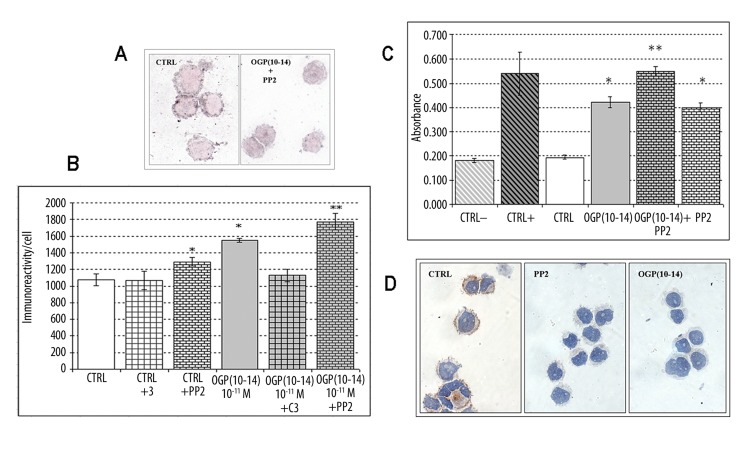
Figure 1.
(A) Mpl expression in M07-e cells cultured for 144 hours. Immunoreaction (silver) is higher on control cells (CTRL) than in OGP(10-14)+PP2 treated cells. Original magnification ×1000. (B) Image analysis of TGFβ1 expression in M07-e cells cultured for 144 hours. *P<0.01 vs control; ** P<0.01 vs OGP(10-14). Error bars represent the SD of the means (n=6). (C) Quantitative activated RhoA expression in M07-e cells cultured for 1 hour. CTRL−: lysis buffer, CTRL+: RhoA-GTP. *P<0.01 vs control; ** P<0.01 vs OGP(10-14). Error bars represent the SD of the means (n=6). (D) Activated Src expression in M07-e cells cultured for 1 hour. Immunoreaction (brown) is present only in control cells (CTRL) Original magnification ×1000.

