Figure 6.
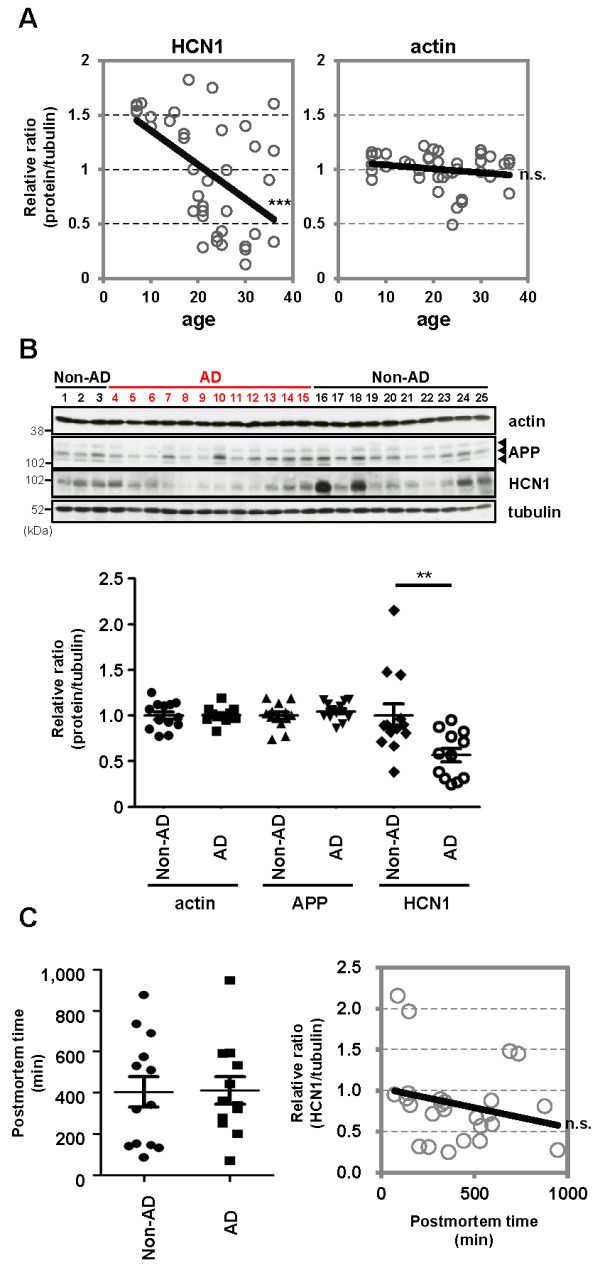
HCN1 levels decrease in a age- and AD-dependent manner. (A) Quantification of the amount of HCN1 and actin in the brain (superior temporal gyrus) of 4–37-year-old cynomolgus monkeys by immunoblotting. Statistical analysis was performed using the two-tailed Pearson's correlation coefficient (HCN1: n = 39, r = −0.5363, ***p < 0.001; actin: n = 39, r = −0.1981, p > 0.05). (B) Quantification of the amount of HCN1, APP, actin, and tubulin in age-matched AD and non-AD postmortem brains (superior temporal gyrus) by immunoblotting. Statistical analysis was performed using the two-tailed Mann–Whitney U-test (non-AD: n = 13, AD: n = 12, **p < 0.01). (C) Comparison of postmortem time between non-AD and AD samples. Statistical analysis was performed using the two-tailed Mann–Whitney U-test (non-AD: n = 13, AD: n = 12, p = 0.8066). The correlation between postmortem time and HCN1 level was analyzed. Statistical analysis was performed using the two-tailed Pearson's correlation coefficient (n = 39, r = −0.2416, p = 0.2446). Descriptions of all subjects are provided in Table 1.

