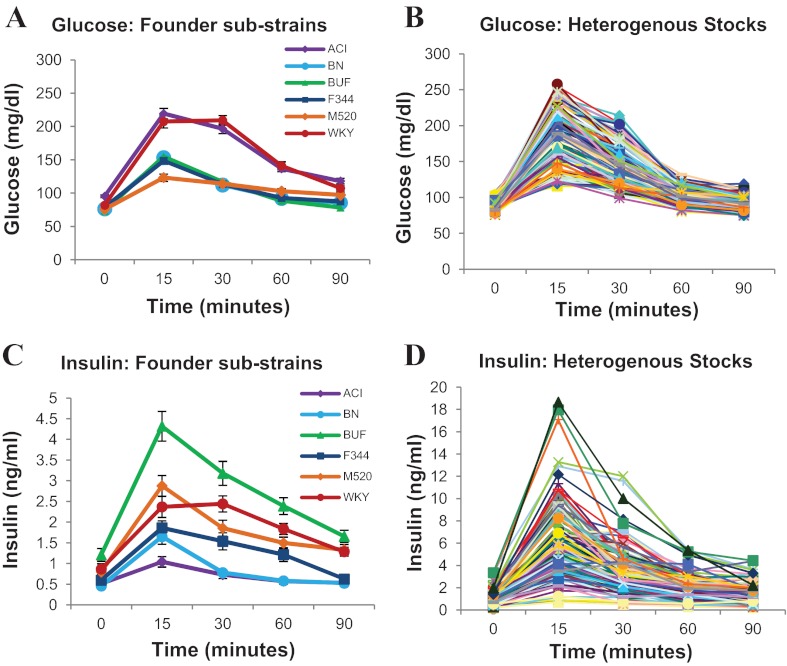
Fig. 1.
Glucose and insulin in response to a glucose challenge in inbred founders (A, C) and heterogenous stock (HS) rats (B, D). Founder curves represent means ± SE of 10–21 animals within each inbred strain. See text for statistical differences between inbred strains. Each line in the HS graph represents an individual animal (200 representative HS rats are shown in graph). Because of the extremely high values for insulin in the HS rats (D), the y-axis differs between C and D, enabling differences between inbred strains (C) to be visualized.

