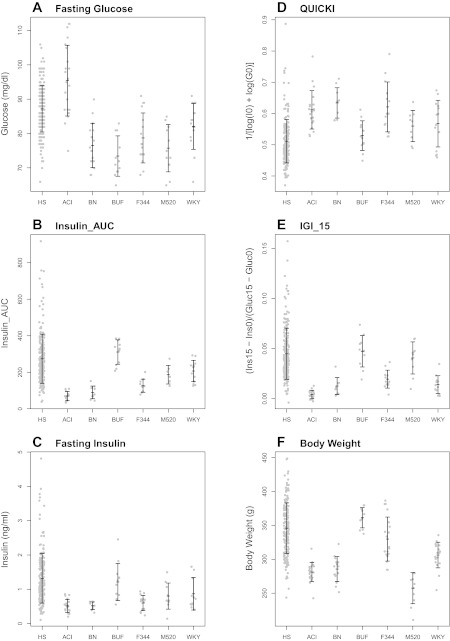
Fig. 2.
Fasting glucose (A), Insulin_Area Under the Curve (AUC) (B), fasting plasma insulin (C), quantitative insulin sensitivity check index (QUICKI) (D), insulinogenic index (IGI_15) (E), and body weight (F) in inbred founders and HS rats. Mean ± SD are shown. Gray dots represent individual animals for 200 representative HS rats or n = 10–21 founder strains. See text for statistical differences between founder strains.

