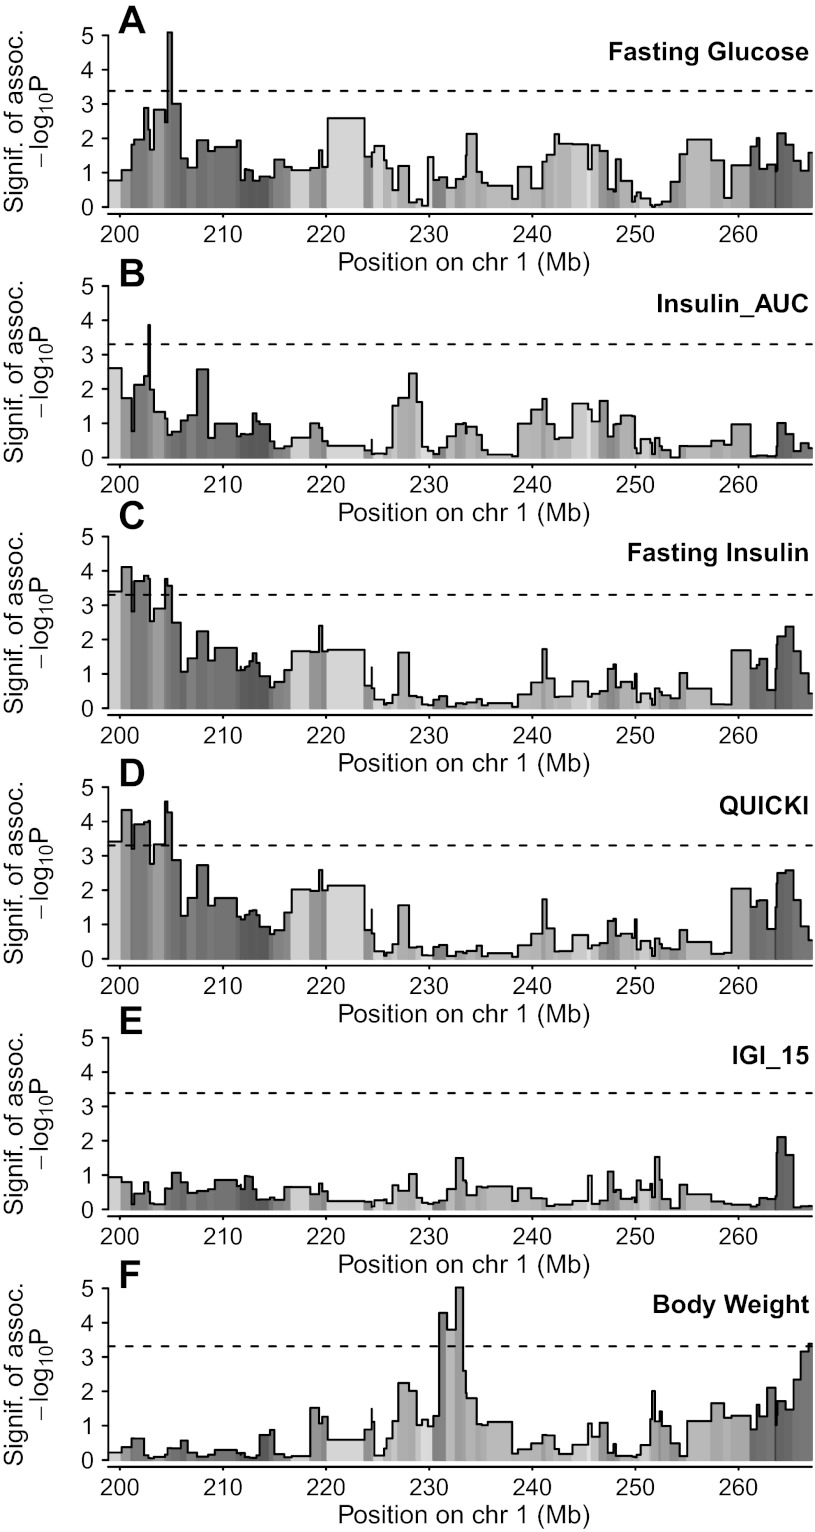
Fig. 4.
Mapping of fasting glucose (A), Insulin_AUC (B), fasting plasma insulin (C), QUICKI (D), IGI (E), and body weight (F) within a 68 Mb region on rat chromosome 1. The x-axis shows position in Mb, and the y-axis gives the −log10P value of association. Dashed lines represent region-wide 5% significance threshold for the full model, which are (in order, to 2 decimal places): 3.38, 3.30, 3.30, 3.30, 3.39, and 3.31. Shading under association line indicates selective information content, or how well genotype information informs haplotype pair descent at each marker interval, with black indicating that descent is known with certainty for all mice, and white indicating complete uncertainty.

