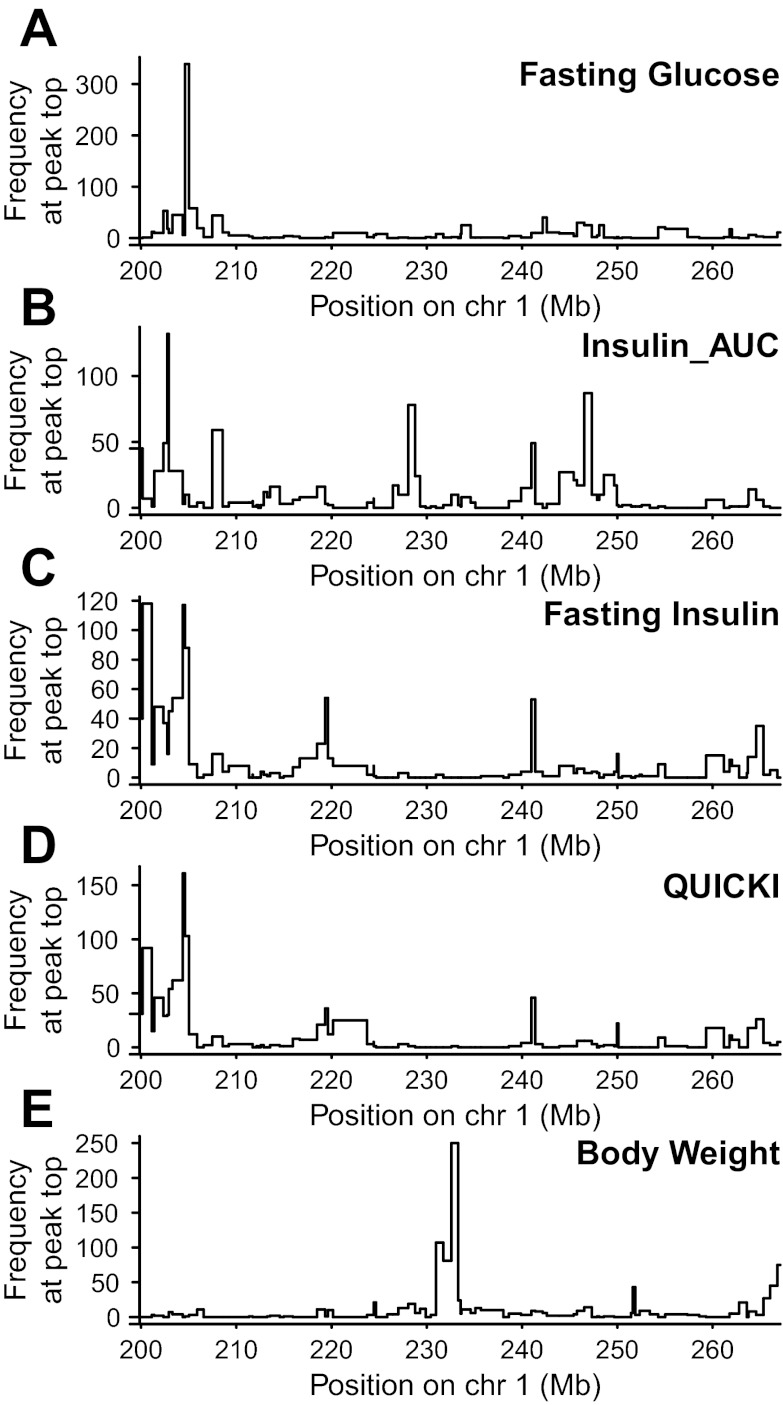
Fig. 5.
Positional bootstrapping across the entire 68 Mb region for fasting glucose (A), Insulin_AUC (B), fasting plasma insulin (C), QUICKI (D), and body weight (E). Histogram shows the number (y-axis) that each marker interval (x-axis, locations in Mb) harbored the strongest association (see text for details) when the analysis was applied to each of 1,000 bootstrapped sets of rats.

