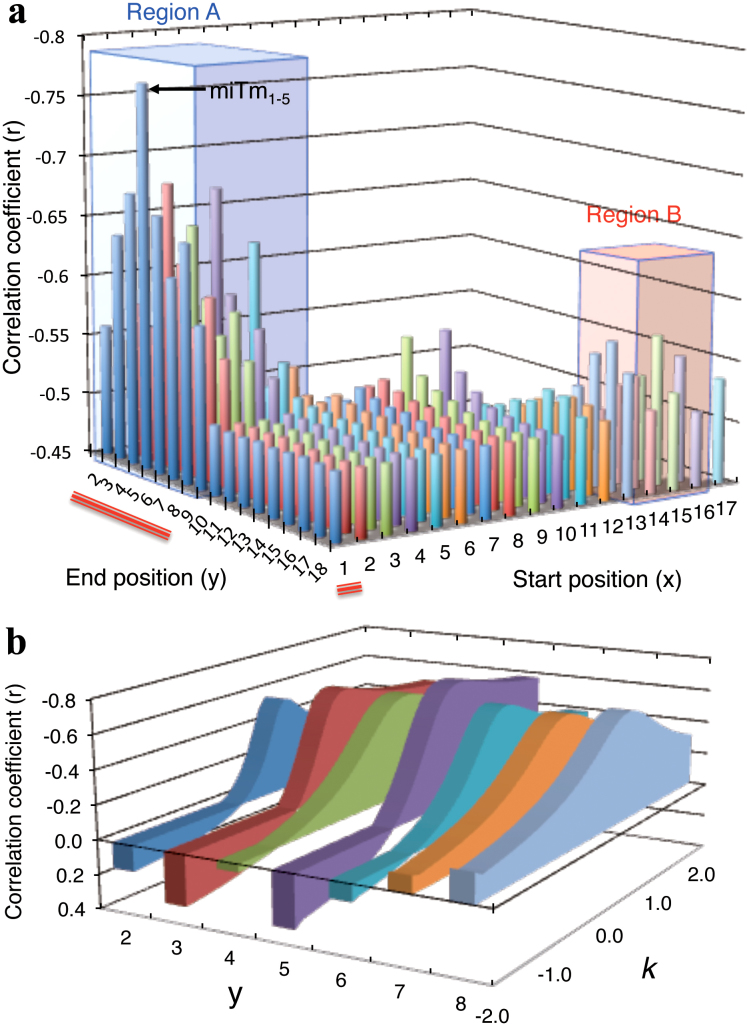
Figure 3. Optimization of the regions and multiplicative factor to estimate possible miRNA-mediated silencing efficacy.
(a) Determination of the optimal start position “x” and end position “y” in the formula Tm2–8 − k × miTmx–y, which shows the highest correlation coefficient with the efficacy of miRNA-mediated gene silencing (relative luciferase activity), using the most-to-least optimal regions. The optimal multiplicative factor k, which was determined as shown in Figure 3b, was used to calculate Tm2–8 − k × miTmx–y for each region. Red lines indicate the region represented in Figure 3b. Regions A and B are areas of high correlation with relative luciferase activity. The strongest correlation was observed in the region 1–5. (b) Examples of fluctuating correlation coefficients between silencing efficacies and values represented as Tm2–8 − k × miTmx–y (x was fixed as 1, 2 ≤ y ≤ 8) depending on k value (−2 ≤ k ≤ 2). The prominent peaks of the optimal correlation coefficients of Tm2–8 − k × miTmx–y with silencing efficiency were obtained around k values of 0.5. The strongest correlation was obtained at k value of 0.53 in the region from x = 1 to y = 5.

