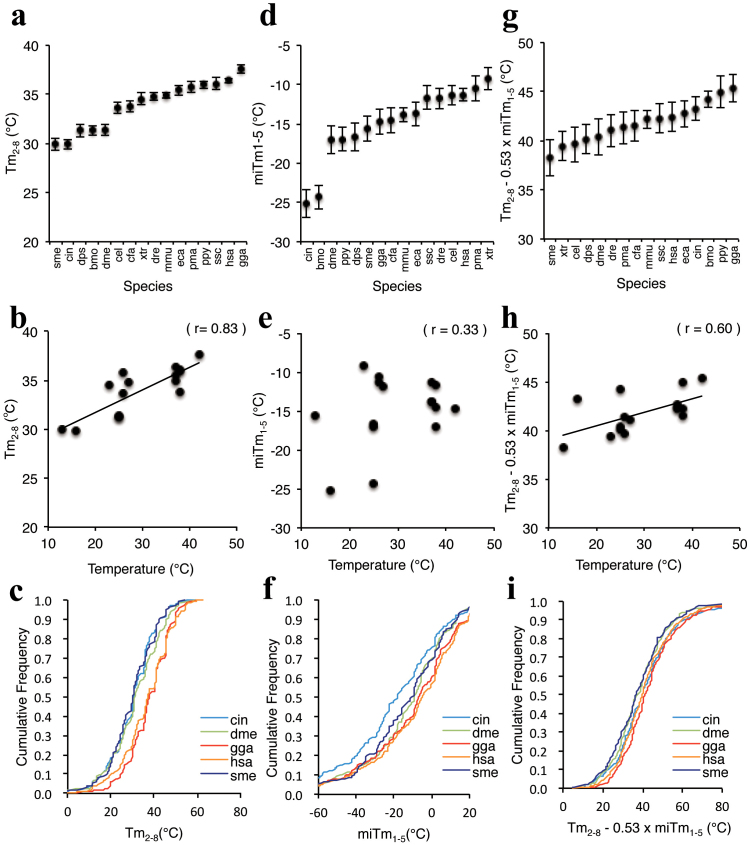
Figure 5. Thermodynamic profiles of miRNAs in different organisms.
Comparison of thermodynamic profiles of miRNAs in various organisms registered in miRBase. Thermodynamic parameters are shown in table S1. MiRNAs registered as double strands with 2-nt 3′ overhangs in both strands of 16 different organisms were ordered as a function of average Tm2–8 (a), miTm1–5 (d), and Tm2–8 − 0.53 × miTm1–5 (g). The correlation between temperature and Tm2–8 (b), miTm1–5 (e), and Tm2–8 − 0.53 × miTm1–5 (h). The miRNAs for C. elegans, C. intestinalis, D. melanogaster, G. gallus, H. sapiens, and S. mediterranea were ordered as a function of calculated Tm2–8 (c), miTm1–5 (f), and Tm2–8 − 0.53 × miTm1–5 (i). Temperatures imply body temperatures for chickens (gga), humans (hsa), mice (mma), dogs (cfa), horses (eca), orangutans (ppy), and pigs (ssc), and rearing temperatures for planarians (sme), ascidians (cin), African frogs (xtr), nematodes (cel), silkworms (bmo), D. melanogaster (dme), D. pseudoobscure (dps), lampreys (pma), and zebrafish (dre). The three-letter abbreviations are provided in figures. Results of a two-sided K-S test for miRNA-mediated gene-silencing activities are as follows: MiRNA Tm2–8 values of H. sapiens compared to those of C. elegans, P ≤ 3.1 × 10⁻⁷; C. intestinalis, P ≤ 2.2 × 10⁻¹⁶; D. melanogaster, P ≤ 2.2 × 10⁻¹³; G. gallus, P ≤ 3.7 × 10⁻²; and S. mediterranea, P ≤ 2.2 × 10⁻¹⁶. MiRNA miTm1–5 values of H. sapiens compared to those of C. elegans, P ≤ 8.2 × 10⁻⁴; C. intestinalis, P ≤ 2.2 ×10⁻¹⁶; D. melanogaster, P ≤ 4.9 × 10⁻⁶; G. gallus, P ≤ 3.0 × 10⁻²; and S. mediterranea, P ≤ 2.0 × 10⁻⁵. MiRNA Tm2–8 − 0.53 × miTm1–5 values of H. sapiens compared to those of C. elegans, P ≤ 2.1 × 10⁻²; C. intestinalis, P ≤ 5.5 × 10⁻¹; D. melanogaster, P ≤ 8.7 × 10⁻⁷; G. gallus, P ≤ 5.7 × 10⁻³; and S. mediterranea, P ≤ 1.8 × 10⁻³.

