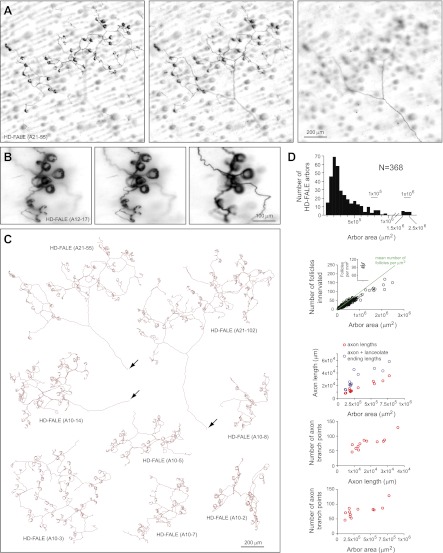
Figure 5. Arbors with high density follicle-associated lanceolate endings (HD-FALE).
(A) Arbor HD-FALE (A21-55) showing superficial (left), intermediate (center), and deep (right) layers. The single axon that gives rise to this arbor is seen at the lower right of the deep arbor image. (B) Higher magnification images at three Z-planes (left to right, superficial to deep) of HD-FALE (A12-17) showing multiple lanceolate endings. (C) Tracings of eight HD-FALE arbors. HD-FALE (A21-55), shown in panel A, is in the upper left. Arrows indicate the afferent axon. (D) For all HD-FALE arbor areas analyzed, arbor area and number of follicles innervated per arbor are shown in the top two plots. In the second plot, the inset shows the determination of the number of follicles per μm2; this value is shown in the plot as a green line. The bottom three plots show the relationships between arbor area, number of axon branch points, and axon length for the 12 traced HD-FALE arbors.

