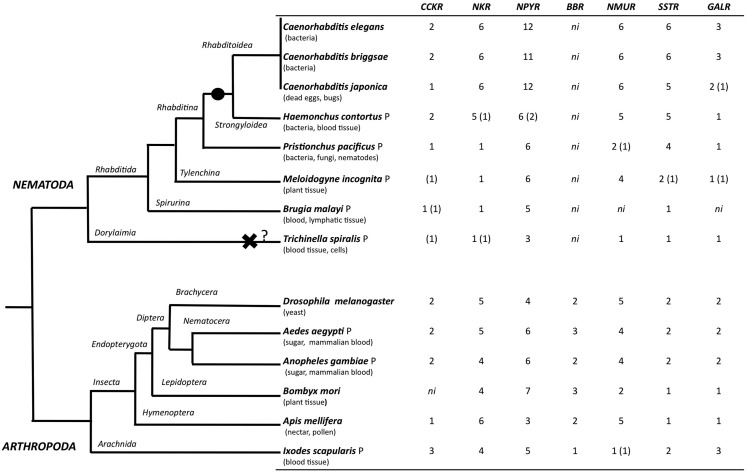
Figure 4.
Distribution of rhodopsin subfamily members in nematodes and arthropods. The phylogenetic relationship of the species analyzed is represented on the right and their feeding habits are indicated. The black circle indicates a putative gene duplication event in the nematode radiation and the black cross potential gene deletion in the T. spiralis genome. Genes that were identified based upon sequence similarity but that were not considered for phylogenetic analysis are indicated within brackets “()”; ni- GPCR member not identified, and P represent parasitic nematode and arthropod. The evolutionary relationship within nematodes and arthropods was obtained from (Consortium, 2006; Sommer and Streit, 2011).

