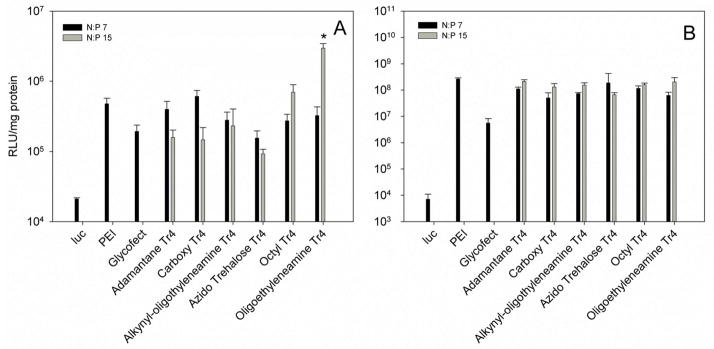
Figure 7.
Luciferase expression and cellular protein levels of HeLa cells 48 hrs after transfection. Polyplexes were formed in water and diluted into DMEM containing 10% FBS (panel A) or serum-free Opti-MEM (panel B) as in the particle size analysis (Fig. 3) prior to transfection. Four hours after transfection, DMEM with 10% FBS was added to each experiment. Bars indicate mean results (n=3); error bars indicate standard deviation. PEI polyplexes were formulated at N/P = 5 and Glycofect polyplexes were formulated at N/P = 20. * p<0.05 relative to all other samples (ANOVA with Tukey’s HSD).

