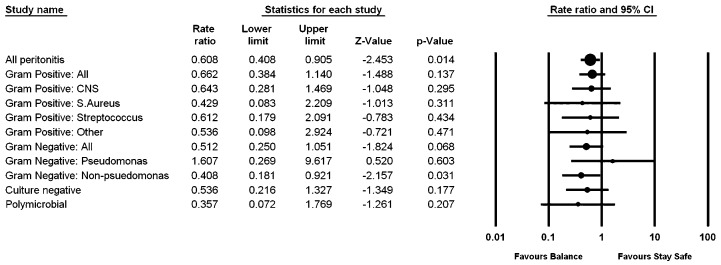
Figure 1.
— Forest plot of organisms responsible for peritonitis episodes in the biocompatible and control groups. Results are presented as incidence rate ratios with 95% confidence intervals (CIs). When a peritonitis episode represented a combination of classifications, the episode was included in both classifications for the Poisson analysis.

