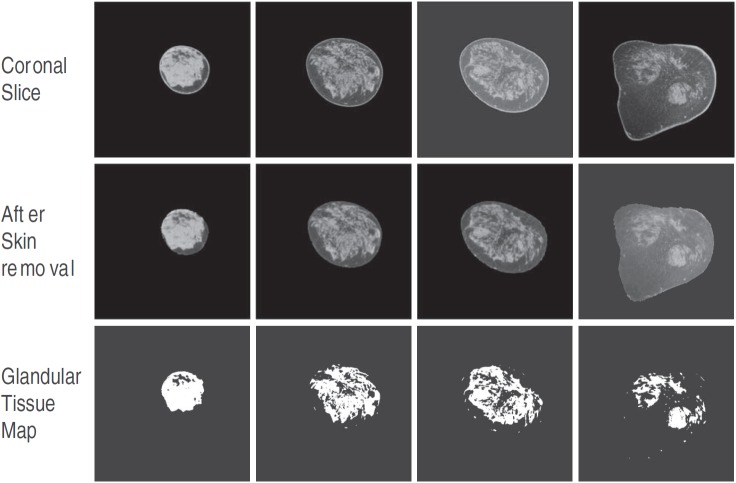
Figure 2.
Four slices selected from a single breast CT volume are shown. The top row contains the coronal slices, the middle row shows the corresponding slices after segmenting and removing the skin, and the bottom row shows the binary maps corresponding to the slices generated using KFCM, where the region representing fibroglandular tissue have a value of 1.

