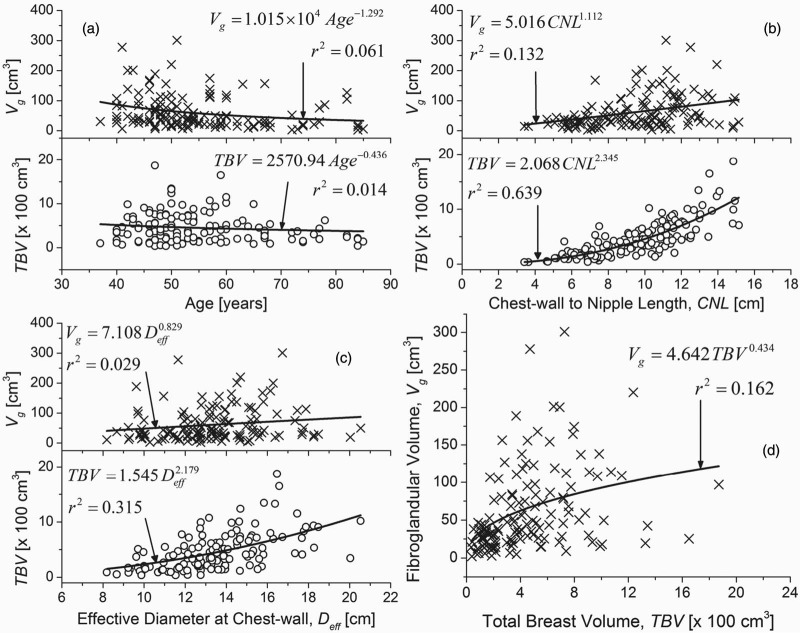
Figure 6.
Scatter plots of fibroglandular volume (Vg) and TBV plotted as a function of (a) age of the participant at the time of breast CT exam; (b) CNL; and, (c) effective diameter of the breast at the chest-wall (Deff). All the aforementioned parameters exhibited significant correlation with either Vg or TBV (Table 2). (d) The scatter plot of Vg as a function of TBV. While Deff includes the skin, Vg and TBV exclude the skin and the areolar region. All plots were fitted with a simple power curve.

