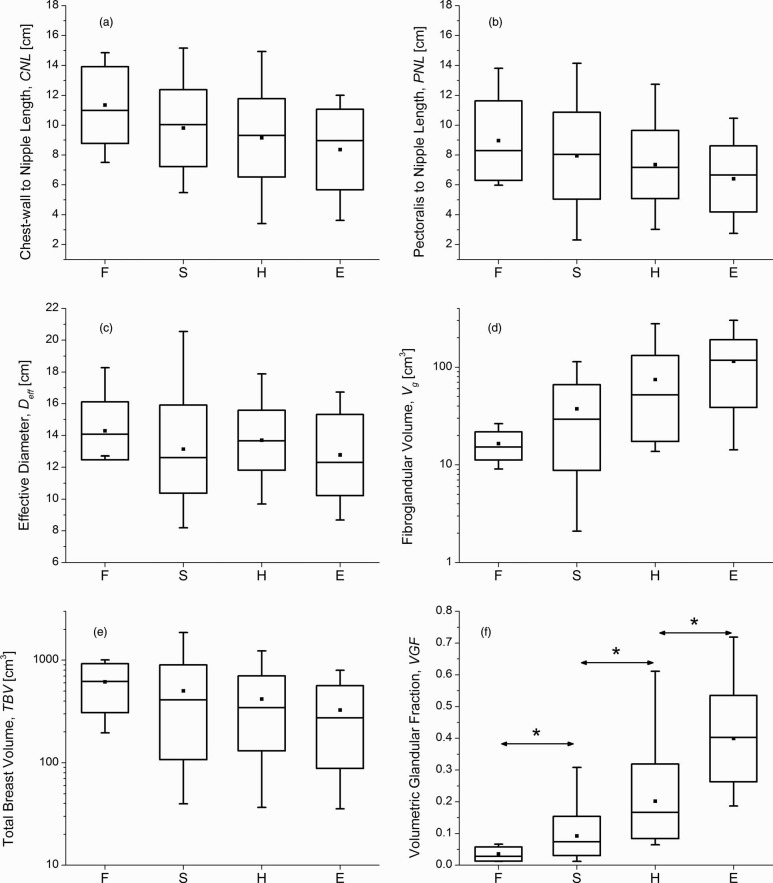
Figure 9.
Box-plots showing the relationships between mammographic breast density (F – almost entirely fat; S – scattered densities; H – heterogeneously dense; E – extremely dense) and (a) CNL; (b) PNL; (c) effective diameter of the breast at chest-wall (Deff); (d) fibroglandular volume (Vg); (e) TBV, and (f) VGF. In all plots, the symbol and line within the box represent the mean and median, respectively, the box-ends represent ± standard deviation from the mean, and the whiskers represent the minimum and maximum. (d) and (e) Log-scale for y-axis. In (f), * indicates statistically significant difference between the distributions.

