
Figure 2.
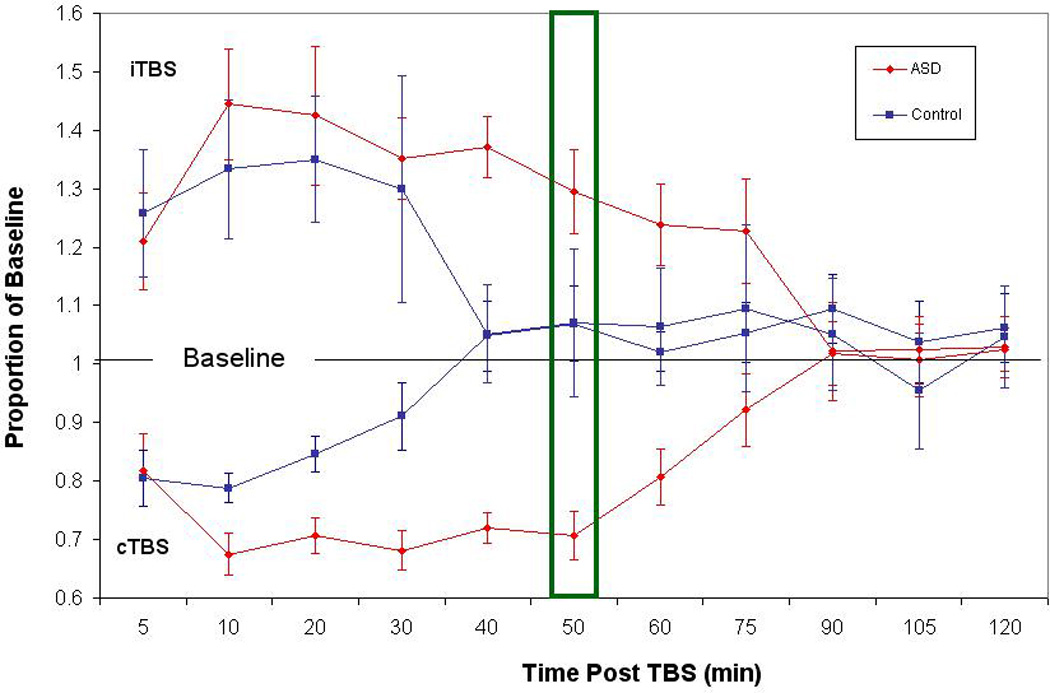
Baseline corrected MEP amplitude following cTBS and iTBS. Average baseline-corrected MEP amplitude for the control group (in blue) and AS group (in red) at 11 time points from 5 minutes to 120 minutes post cTBS. In error bars indicate standard error of the mean for each time point. Values are represented as proportion of baseline amplitude with a line at 1.0 (representing baseline amplitude). The box at the 50 minute time point represents the criterion determined by the ROC curve to be the point of maximal sensitivity and selectivity between the groups.