
Figure 4.
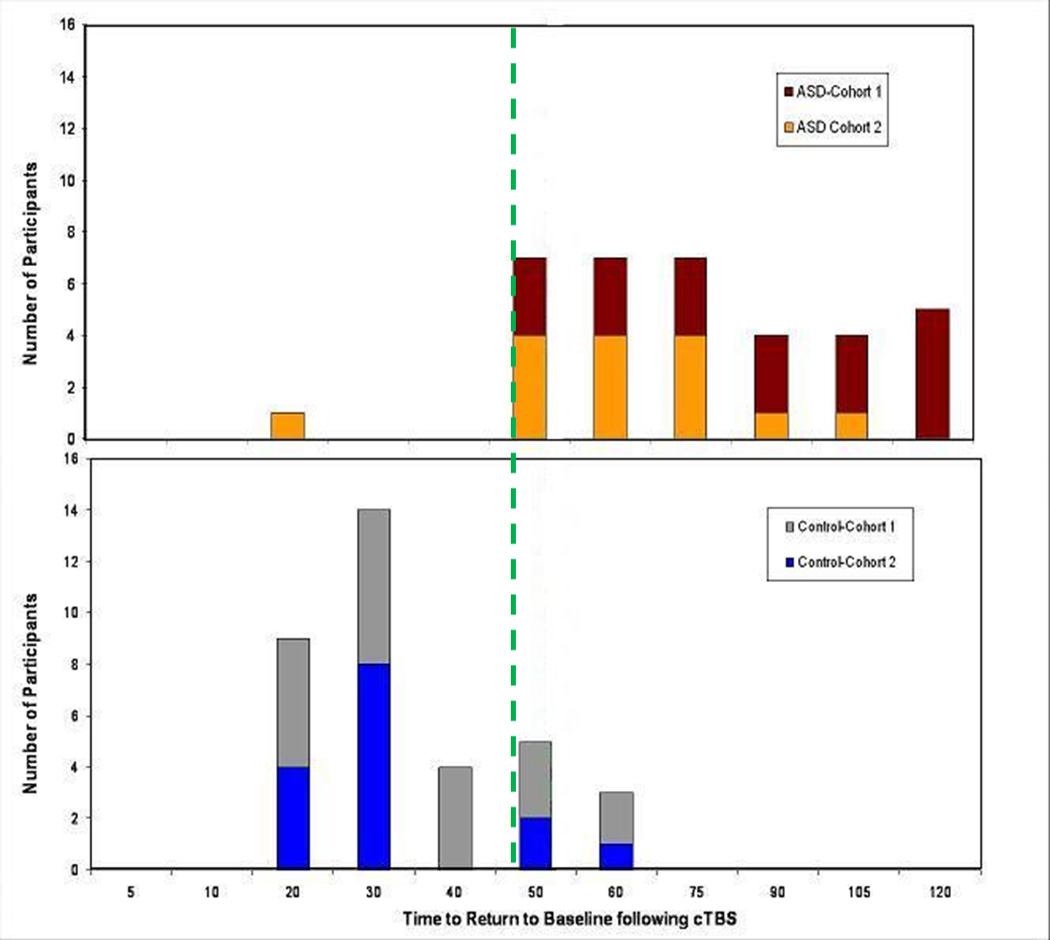
Summary of individual results: Distribution of the number of subjects from each study group (AS top graph; neurotypical controls in bottom graph) and their time to return to baseline the TMS-induced potentials following theta burst stimulation. Note that there is an almost complete separation of the results for all subjects in both the first cohort (brown, gray) or second cohort (orange, blue) with cTBS. 34 out of 35 AS subjects show a duration of the modulatory effects of cTBS of 50 minutes or longer while 27 out of 35 neurotypical control participants show a duration of less than 50 minutes. The dashed green line at 50 min following the TBS is the calculated time for greatest diagnostic value of the test.