
FIGURE 2.
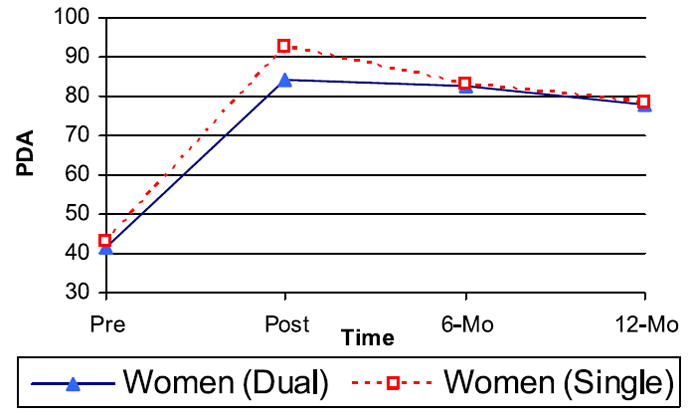
Female patient sample observed mean values for percent days abstinent (PDA) outcomes of dual versus single problem couples. Triangles represent the PDA mean value at four assessment points for female patients in dual problem couples; squares represent the PDA mean value at four assessment points for female patients in single problem couples. (color figure available online)