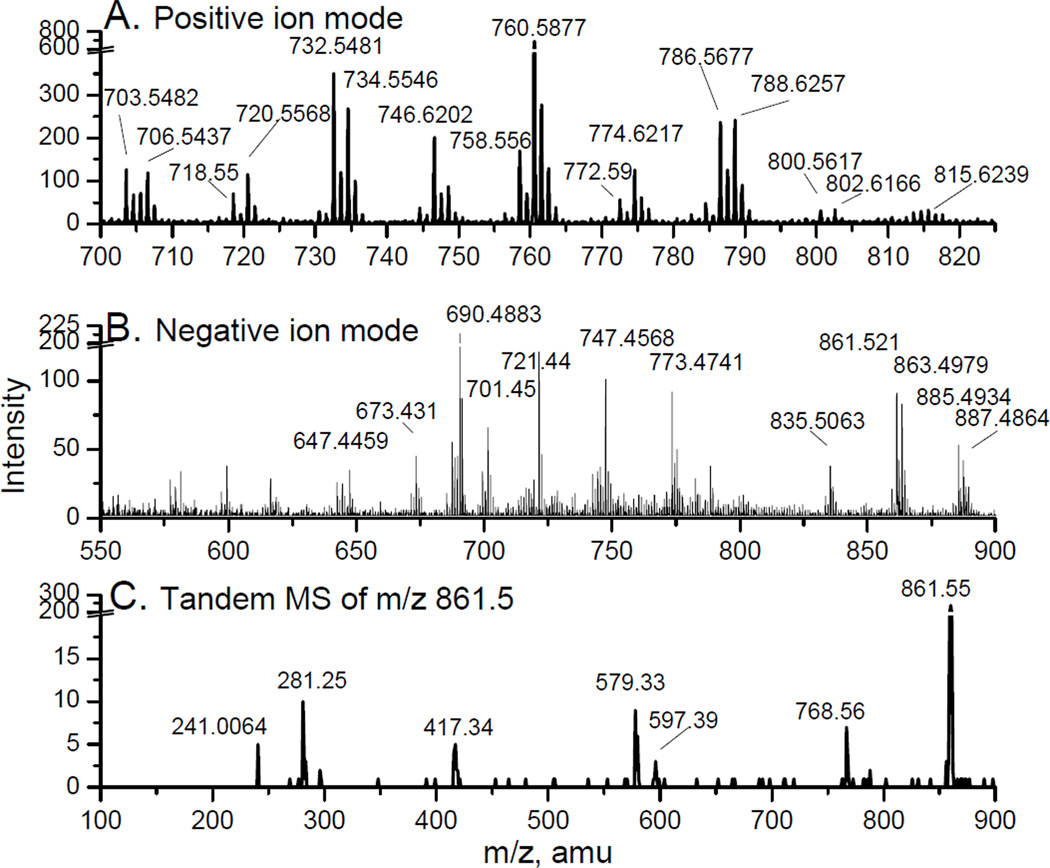
Figure 1.
The positive (a) and negative (b) ion mode ToF-MS spectra obtained with C60-SIMS of lipid extract taken from RAW 264.7 cells shows the abundant number of detectable glycerophospholipid species. Tandem MS spectrum of m/z 861.5 in the negative ion mode (c) is similar to the LIPID MAPS reference spectrum for PI (18:1/18:1).

