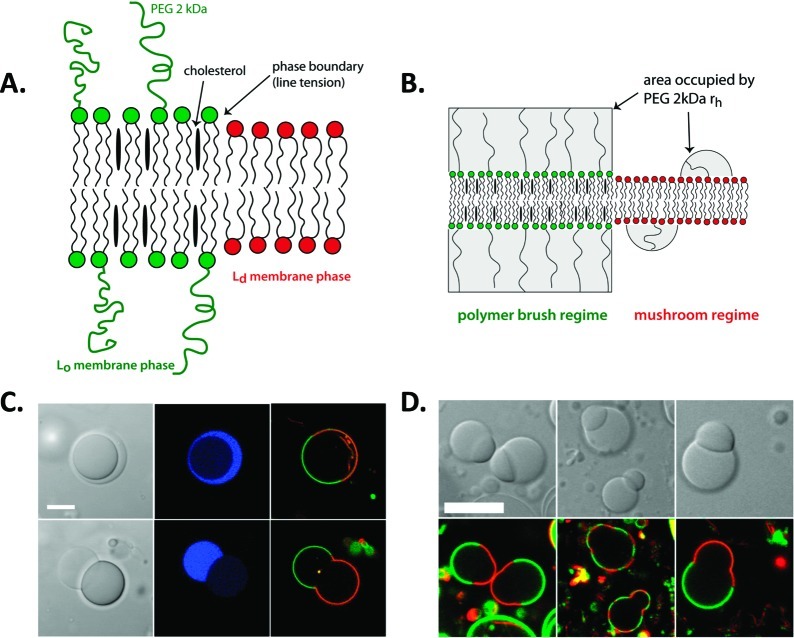
Figure 7.
Correspondence between interior aqueous microcompartments and membrane phase domains. Illustrations of (A) phase separation in ternary lipid mixture, and (B) higher surface density of PEGylated headgroups leading to polymer brush regime for Lo domain while surface densities for Ld domain are in the mushroom regime. (C) Optical microscope images for an ATPS-containing GV before and after undergoing a budding transition. (D) Effect of temperature on lipid phase domain distribution on budded GVs. Blue indicates the PEG-rich aqueous phase, green fluorescence indicates PEGylated Lo lipid domain, and red indicates Ld lipid domain. Reprinted with permission from ref (42). Copyright 2008 American Chemical Society.

