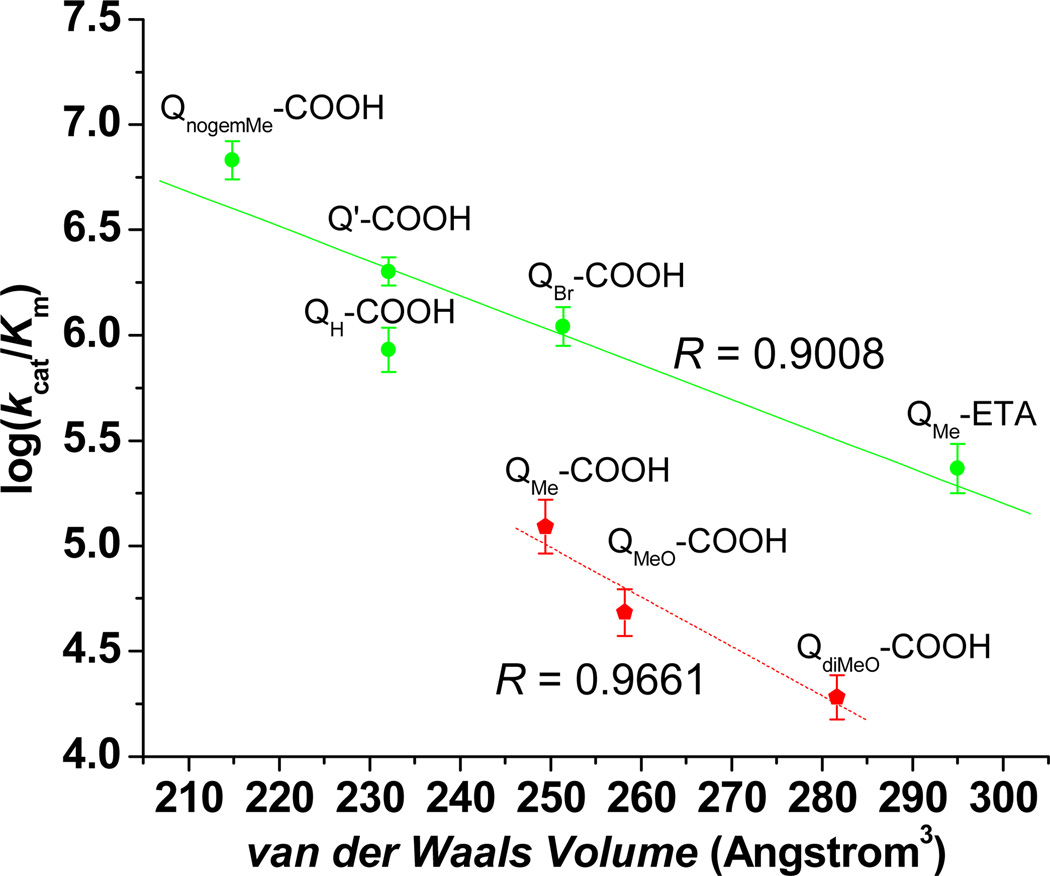
Figure 1. Relationship between substrate specificity and quinone propionic acid van der Waals volume for fast (green points/line) and slow (red points/line) substrates.
Lines are the best fit to the data points as obtained by linear least-squares analysis. Error bars represent one standard deviation (n = 3). The van der Waals volumes were calculated according to the literature.89

