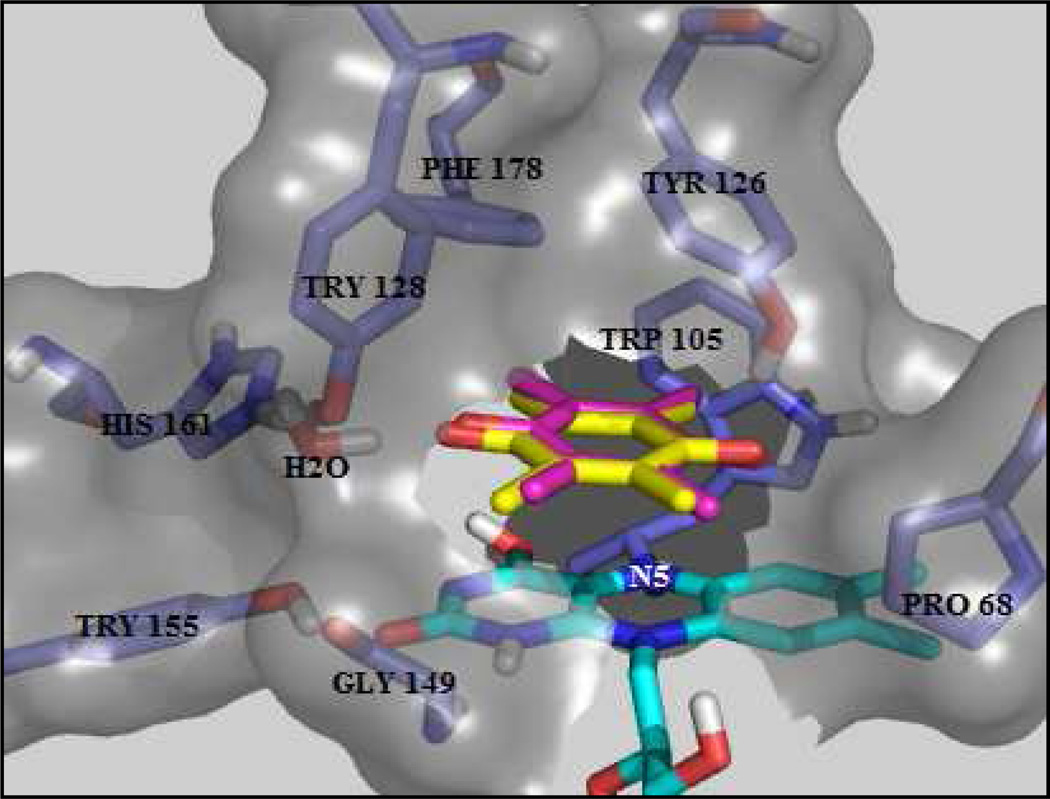
Figure 2. Best prediction for docked duroquinone in receptor 1 compared with the position of the duroquinone in the original crystal structure.
The position of the docked duroquinone (pink) differs from the original duroquinone (yellow) as noted by the 0.45 Å root-mean-square deviation (RMSD). Representation of amino acids (stick display; color by atom type, carbon atoms colored in purple) and FAD (sticks display; color by atom type, carbon atoms colored in cyan) in receptor 1.

