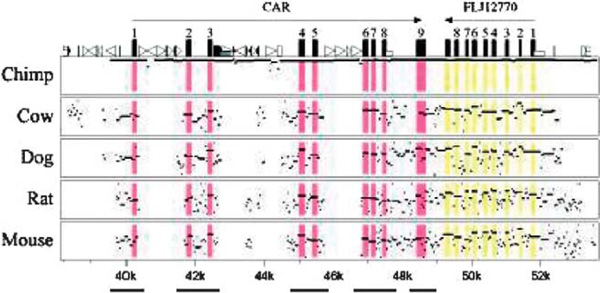
Figure 1.

MultiPipMaker plot illustrating sequence conservation at the CAR locus. The vertical axis ranges between 50 per cent and 100 per cent sequence identity; areas within the plot shaded in pink correspond to the exons of CAR and those shaded in yellow correspond to exons of the predicted protein FLJ12770. Bars along the bottom indicate the segments included in the resequencing survey. Numbers across the bottom indicate the position relative to the reverse-complemented reference sequence (AL50974).
