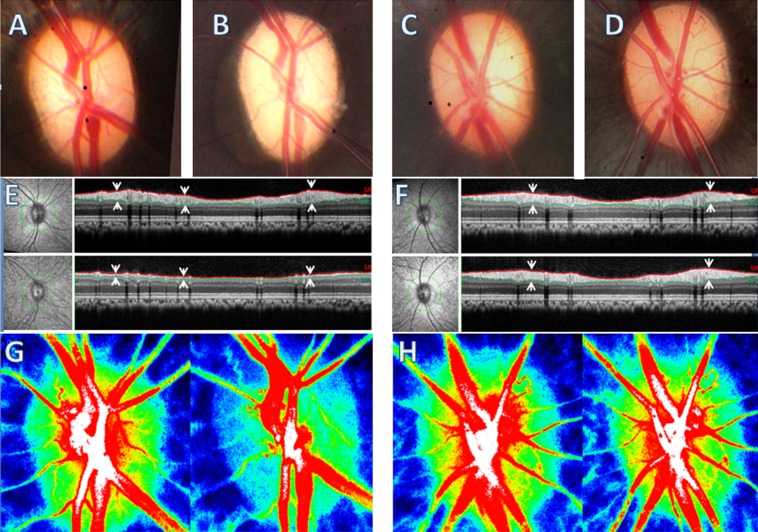
Figure 1. .
Left panels: Example of EG eye. Right panels: The fellow control eye. The average IOP in the EG eye was 30 mm Hg and 17 mm Hg in the control eye during the 4.5-month period of IOP elevation. The fundus photograph in the EG eye at the last time point examination (B) shows optic disc pallor compared with its baseline (A); there was no change in the control eye [C] versus [D]. The photograph on the left of (E) and (F) show the infrared image of the fundus. The peripapillary green circles show the path of the B-scan from which the RNFLT is measured (right). The RNFLT in the EG eye (E) was reduced by 62% at the final time point (lower panel) from baseline (upper panel); there was no RNFLT change in the control eye (F). RNFLT is marked by the paired arrows, which point to the anterior and posterior borders, and marked with red and green lines, respectively. (G, H) ONH LSFG MBR composite maps measured at baseline (left) and final time point (right), respectively. The BF is encoded with pseudocolor from high (red) to low (blue). Note the superotemporal ONH BF at the final time point in the EG eye ([G], right) is lower compared with baseline ([G], left), which represents 29% of overall ONH BF decrease.

