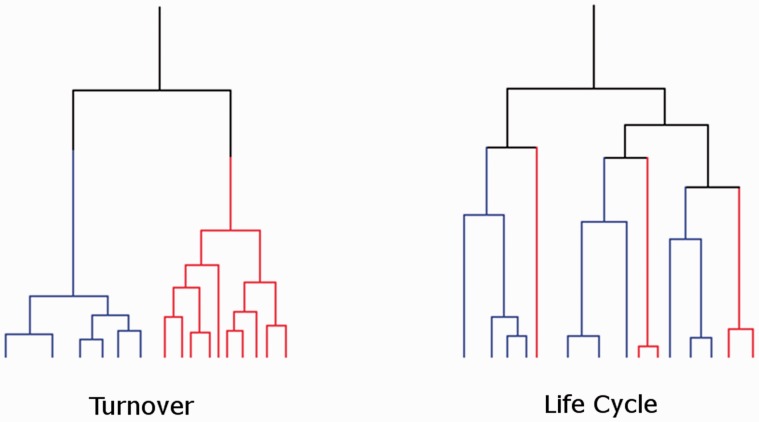
Fig. 1.
Diagram showing phylogenies resulting from a life cycle or turnover process. Example phylogenetic trees expected from the lifecycle or turnover processes. Red and blue lines represent elements from different mammalian orders. The MRCA of elements from each mammalian order fall at different times from each other in the turnover process but at the same time in the lifecycle process. The life cycle process also has an MRCA much closer to the origin of the family than in the turnover process.

