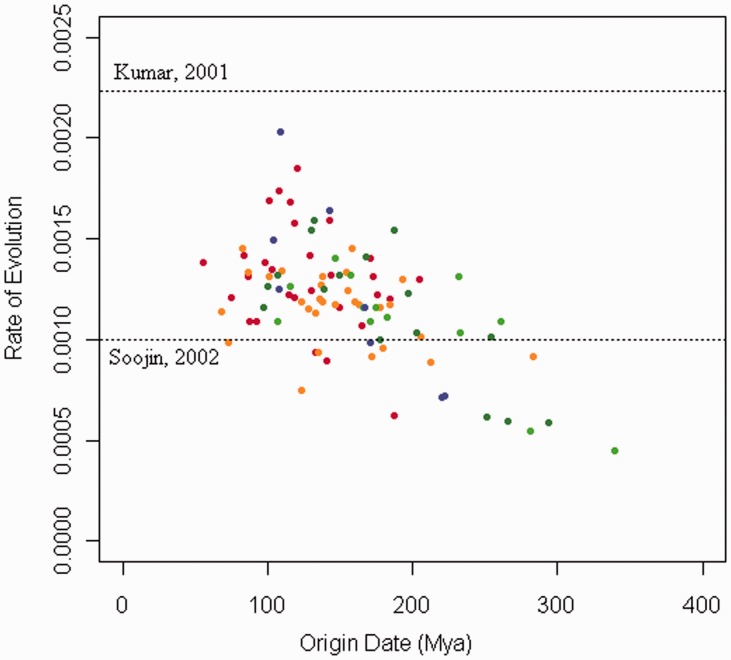
Fig. 7.
The effect of differing evolutionary rates on the prediction of the element MRCA. Plot showing the mean rate of evolution (clock.rate) and the mean time to element MRCA (treemodel.rootHeight) for each of the BEAST analyses; data from different families and using different orthologous pairs have been pooled. The colors show the pairs of orthologs used in the order: human–chimp (red), human–orangutan (orange), dog–panda (dark green), dog–cat (light green), and cow–pig (blue). Dotted lines show mammalian evolutionary rates suggested in the literature.

