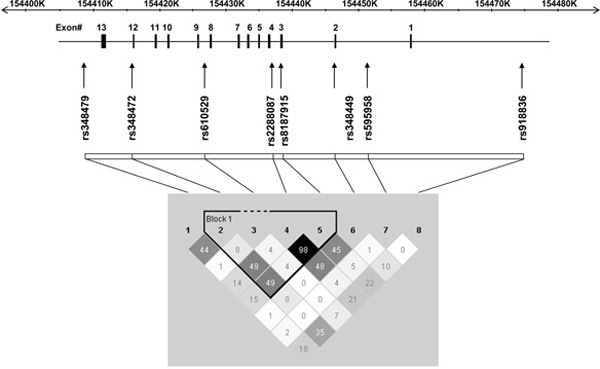
Figure 1.

A schematic representation of the human ALDH1A1 gene structure and linkage disequilibrium (LD). The gene structure of ALDH1A1 is shown with exons numbered and relative exon size denoted by the width of the vertical bars. The eight SNPs analysed in this study are shown in relation to their location across ALDH1A1 and regions of low to high pair-wise LD, as measured by the r2 statistic, are represented by light grey to black shading, respectively.
