
Figure 2.
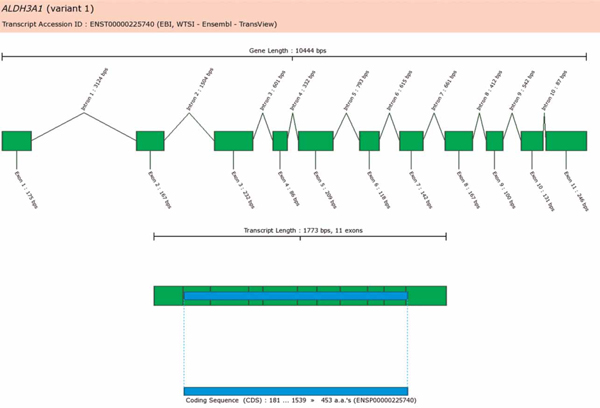
Graphical representation of the transcript sequence for individual accession identifiers. Each accession identifier's sequence within the database is analysed for inter- and intra-sequence structure. Data from this analysis is then parsed and graphically represented for each accession identifier in the 'Accession Identifier Detail Reports' section found under Molecular Features for each gene record. If present, any variations in the transcript sequence as a result of synonymous and non-synonymous polymorphisms relative to the genomic sequence are highlighted.