
Figure 3.
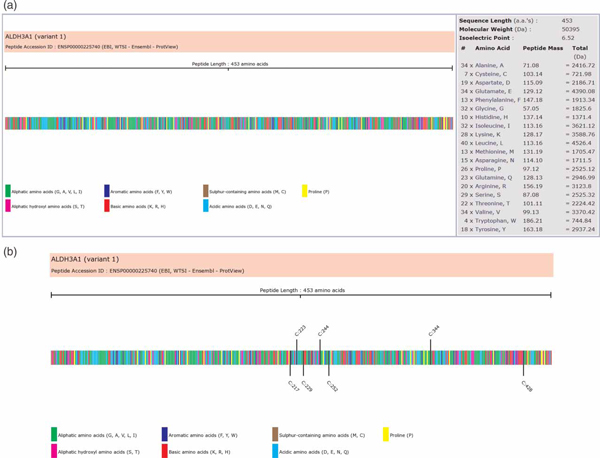
Graphical representation of the peptide sequence for individual accession identifiers. Peptide translation for each transcript sequence is represented by a multicoloured graphic of the primary sequence based on amino acid content (Figure 3a). If present, any variations in amino acids as a result of synonymous and non-synonymous polymorphisms relative to the genomic sequence are highlighted. In addition, users are able to view the locations of various residues within the peptide sequence (eg cysteine residues; Figure 3b) by clicking on a specific residue in the amino acid content table of Figure 3a.