
Figure 4.
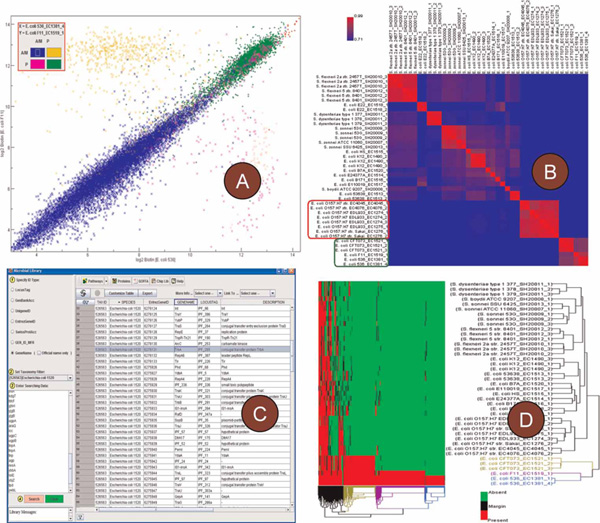
Enhancements in ArrayTrack to support microbial pathogen microarray genetic profiling data. (A) A mixed scatter plot with flag indicators. (B) A reorganised flag concordance heat map which visually displays the similarity of strains in gene presence/absence calls. (C) The user inference for the Microbial Library. (D) A flag-based two-way hierarchical clustering analysis plot which clusters similar strains together based on the presence/absence profile of genes.