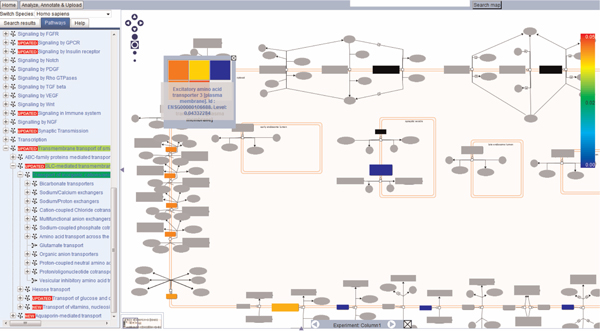
Figure 4.

Gene expression dataset overlaid upon an SLC transporter pathway. The data indicate those SLC proteins which are upregulated in the human brain and act as symporters. The colour chart on the right indicates the range of regulation, from blue (downregulation) to red (upregulation). Blacked-out hits indicate complexes. Right-clicking on the complex will show all proteins in that complex, individually coloured. Here, the group of excitatory amino acid transporters show varying expression in the brain, indicated by the colour scheme. Proteins not hit by the dataset are greyed out.
