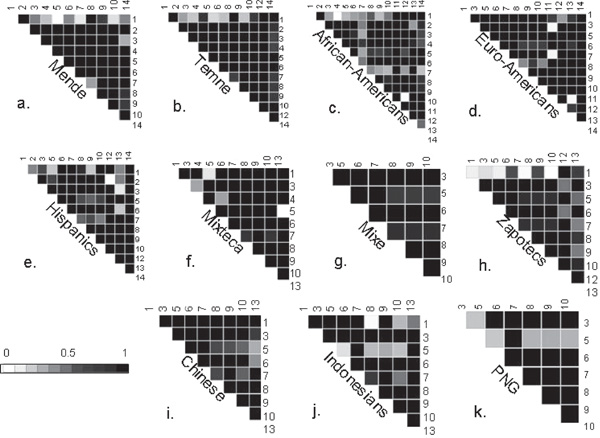
Figure 1.

(a-k) The D' statistic for pairwise comparisons of the 14 SNPs genotyped in 3p21 in each population sample. The axes of each plot indicate those polymorphic SNPs included in each analysis. SNP labels refer to numbering system described in Table 1. Abbreviations: Euro-Americans = European-Americans; PNG = Papua New Guineans.
